The Latest Banking Crisis: Quickly Contained or 2008 Redux?

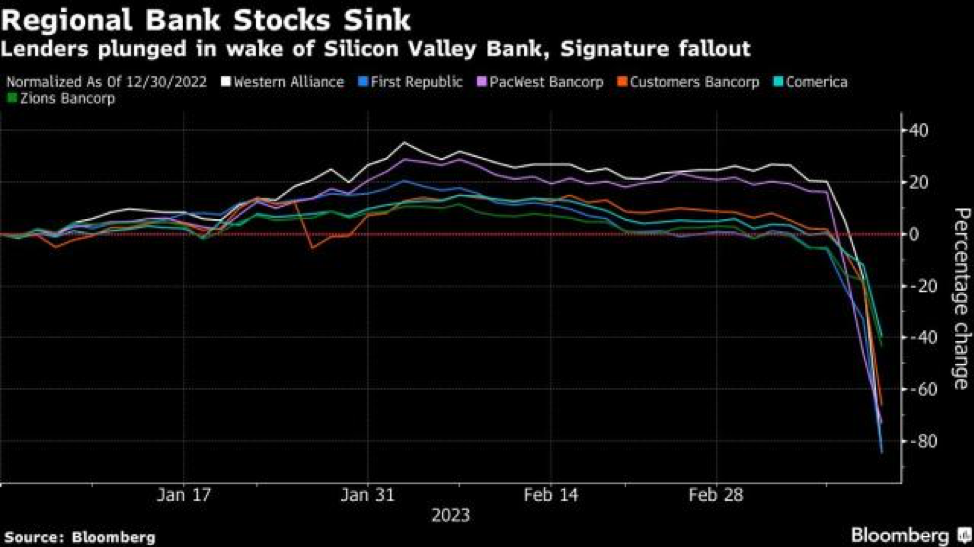
Over the past few weeks, we’ve experienced the second- and third-largest U.S. bank failures as well as the collapse of the 167-year-old Credit Suisse Bank (CS). With three U.S. banks down, the Swiss government brokering the acquisition of CS by UBS in Europe, and a teetering First Republic Bank (FRC) of San Francisco, it has conjured up memories of the 2008 financial crisis. To think that these recent bank failures are isolated incidents, or “outlier events,” as our Federal Reserve Board Chair described them, misses the broader point: Banks exist based largely on trust and confidence, and the industry has been damaged by these recent failures.
 
The failure of Silicon Valley Bank (SIVB) has fueled fears of financial contagion risk. Are SIVB and the other bank failures truly isolated incidents or an ominous sign of more failures to come? To answer this question, let’s examine the key facts behind the sudden collapse of our nation’s 18th-largest bank.

Why did SIVB fail?

  • Homogeneous clientele: SIVB was nearly entirely exposed to the technology sector because it catered to the venture capital community in Silicon Valley. It attracted their capital by promising higher rates on savings accounts than its competitors. In recent years, this strategy worked well. SIVB had a huge inflow of large depositors from venture capital and private equity customers. The bank’s deposits nearly quadrupled from $49 billion in 2018 to $189.2 billion at the end of 2021.

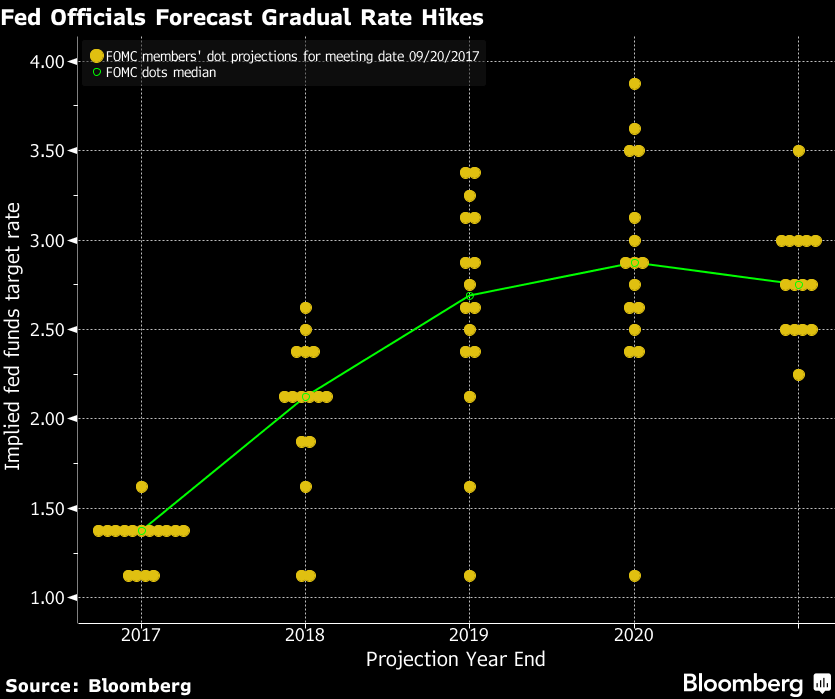
  • Reckless interest rate risk: Back in March 2022, the average forecast of Fed policymakers was for rates to end 2022 below 2.00% as they thought inflation would prove to be “transitory.” Just over one year ago, the federal funds interest rate was 0.25% – 0.50%. After last week’s hike, it now stands at 4.75% – 5.00%. The Fed’s current hiking cycle is the largest percentage increase over the shortest amount of time in U.S. history. SIVB locked up about $100 billion of cash in longer-maturity mortgage-backed securities (MBS). Given the near-zero interest rate environment at the time, the bank locked in low yields that generated some interest income for the bank and its customers. This exposed the bank to huge risk once interest rates rose rapidly throughout 2022 due to the Fed’s super-aggressive rate hiking campaign to combat toxic inflation. Thus, the longer-term government bond assets that have always been funded with shorter term deposits lost value. Note: The value of a bond in relation to interest rates reacts like a seesaw — as one end rises, the other end falls, and vice versa. A prudent asset manager would have bought interest rate protection using derivatives known as swaptions or shortened bond duration.

  • The first Twitter-induced bank run: SIVB’s announcement that it would liquidate $20 billion of its investments in government securities to meet withdrawal requests sparked fear among its homogeneous client base of wealthy tech execs and venture capitalists. On March 8, some prominent figures in the venture capital industry encouraged SIVB depositors to pull their funds resulting in the first Twitter-induced “bank run.” By the close of business that day, $42 billion in deposits had left Silicon Valley Bank! As deposits fled, SIVB was forced to book what had only been paper losses on mortgage and treasury holdings (due to the Fed rate hikes noted above), realizing almost $1.9 billion in losses. By the close of business on March 9, SIVB had a negative cash balance of about $958 million and was insolvent. It was an embarrassing case of very basic asset liability mismanagement.

How did authorities respond?

A lack of clarity from regulators about whether depositors over the FDIC-insured limits would be bailed out created market stability issues. So, on Sunday evening, March 12, the Treasury, Fed, and FDIC together announced that they would be covering all depositors of both SIVB and Signature Bank. The FDIC stated: “All insured depositors will have full access to their insured deposits no later than Monday morning, March 13, 2023. The FDIC will pay uninsured depositors an advance dividend within the next week. Uninsured depositors will receive a receivership certificate for the remaining amount of their uninsured funds. As the FDIC sells the assets of Silicon Valley Bank, future dividend payments may be made to uninsured depositors.”

Of SIVB’s deposits, 93.5% (estimates vary by source) were over the FDIC limit, meaning they were uninsured and making them more prone to flight in times of trouble.

The Federal Reserve created the Bank Term Funding Program to provide emergency liquidity to U.S. depository institutions. In sharp contrast to 2008, when there was no way for Bear Stearns or Washington Mutual to borrow from our nation’s central bank, this new liquidity facility lets banks borrow against securities that have lost value and limits the risk of financial contagion by creating a backstop for banks that find themselves short on cash.

Were Silicon Valley Bank and Signature Bank bailed out?

Many consider the decision to fully reimburse depositors over the FDIC limit of $250,000 a “bailout” that sets a precedent and presents a moral hazard. However, this is an important distinction: The equity shareholders and bondholders were not bailed out with taxpayer dollars like the investment banks in 2008. The Dodd-Frank Act of 2012 strictly forbids bailouts with tax payer dollars. Our regulators contend that the depositors were made whole due to the need to contain financial contagion.

In an article written by Alexis Keenan of Yahoo Finance titled, “Inside the legal loophole U.S. regulators used to bail out SIVB depositors,” she writes: “The FDIC tapped a single exception to banking law known as the Systematic Risk Exemption (SRE), as a caveat in the 1991 Federal Deposit Insurance Corporation Improvement Act (FDICIA), a law that requires that the Federal Deposit Insurance Corporation (FDIC) impose the ’least cost‘ on taxpayers when it uses its Deposit Insurance Fund (DIF) to wind down failed banks. … However, the exception, invoked four times in response to the 2008 financial crisis, and pared down under the Dodd-Frank Act, can extend reimbursement to uninsured deposits when the U.S. Treasury Secretary decides that the additional FDIC assistance would lessen ’serious adverse effects‘ to economic conditions or financial stability, otherwise bound to happen under the ’least cost‘ response.”

Where were the regulators?

President Trump’s 2018 loosening of the Dodd-Frank Act’s bank regulations still subjected banks between $100 billion and $250 billion to periodic supervisory stress tests, which the Fed decided to conduct on a biannual basis.

According to a recent article by Roosevelt Institute fellow Todd Phillips titled, “How 2018 Regulatory Rollbacks Set the Stage for the Silicon Valley Bank Collapse, and How to Change Course,” he stated, “SIVB was not subject to the last supervisory stress test conducted in 2021. Subsequently, it should have been subject to supervisory stress testing in 2022, but it was not tested. Stress testing the bank would have required SIVB to fund itself with more regulatory capital.”

At the end of the day, SIVB’s collapse is a classic case of mismanagement on numerous fronts. And, how did regulators allow a bank to grow so quickly and not conduct a stress test?


Will First Republic Bank (FRC) of San Francisco make it?

“March 12 (Reuters) - U.S. private bank First Republic Bank (FRC) said on Sunday it had secured additional financing through JPMorgan Chase & Co (JPM), giving it access to a total of $70 billion in funds through various sources.”

First Republic has become the latest focal point of the rolling bank crisis. Like SIVB, FRC has a large number of uninsured depositors or ultra high net-worth individuals, making it susceptible to a run. However, unlike SIVB, it has about 64% of its deposits uninsured and has nothing near the unrealized losses SIVB had in its bond portfolio. FRC also holds about $100 million in high-quality mortgage loans, of which 64% are hybrid loans (fixed to floating rate). Analysts estimate that about $70 billion has been pulled from the bank since SIVB’s failure.

On March 16, 11 banks, following the lead of Jamie Dimon of JP Morgan, pledged $30 billion in deposits to be left on FRC’s balance sheet for the next four months. Dimon’s leadership is reminiscent of the Panic of 1907 when J. Pierpont Morgan brought together his fellow bankers to shore up banks that had seen a run on their deposits, helping stave off a financial crisis. Famed hedge fund manager Bill Ackman tweeted that the recycling of deposits was a fictional vote of confidence (paraphrased) and pressed for the government to back all FRC deposits temporarily. I respectfully disagree. You may recall when 14 banks banded together to wind down long-term capital management to prevent the spread of global financial contagion risk in 1998. I had just completed Merrill Lynch’s two-year professional development program. It worked then, and I believe a private solution led by Jamie Dimon will work now. Hopefully, an announcement will soon detail an private offering of convertible preferred shares or warrants to select investors. Warren Buffett structured such deals with Bank of America and Goldman Sachs during the 2008 GFC. It will boost the market’s confidence if he’s involved in a private offering of FRC securities. Either way, FRC will emerge as a much smaller bank, perhaps about $50 billion in size, as its current share price reflects. The sooner we have clarity on a restructuring deal, the better, as it will bring closure to the latest banking debacle.

Are my accounts at Schwab (SCHW) safe?

Recent headlines have overblown concerns regarding Schwab’s held to maturity bond portfolio and cash sorting woes. Schwab does not have a liquidity problem, but it does face some short-term headwinds.

Cash sorting explained: Charles Schwab, and other bank/brokerages, sweeps customers uninvested cash into low-yielding accounts, which generate high profits for Schwab known as net interest margin (the difference between the interest earned on the company’s bond portfolio and the payout to customers sweep accounts). With short-term interest rates approaching 5%, Schwab is experiencing outflows from it lower yielding accounts to higher paying options, such as CD’s, Treasury bills, and their money markets. Money markets charge a management fee, but it’s not nearly as profitable as the sweep accounts.

According to a WSJ article titled, As Interest Rates Rose, Banks Did a Balance-Sheet Switcheroo,” published on March 29, 2023, the authors state: “The Wall Street Journal identified six large U.S. banks, including Charles Schwab Corp. and PNC Financial Services Group Inc., that together switched the classifications on more than $500 billion of their bond investments last year. For some banks, excluding the unrealized losses from their balance sheets, allowed them to report robust levels of capital when in reality their assets were worth much less. … The biggest such reclassification was by Charles Schwab, which is structured as a savings and loan holding company and regulated by the Fed. It transferred $188.6 billion of securities to the held-to-maturity category from available-for-sale. Schwab wasn’t labeling any of its bonds as held-to-maturity at the end of 2021.”

Schwab is a very different financial firm from SIVB and FRC for the following reasons:

  • SIVB had a homogeneous segment of the deposit market, namely venture capital and private equity companies. In contrast, Schwab is more diversified across different customer segments.

  • SCHW is the nation’s second-largest brokerage with $6.6 trillion under management. Schwab is insured by Securities Investor Protection Corporation (SIPC) up to $500,000 per account, higher than the $250,000 for the FDIC and banks.

  • Key insiders recently bought the stock in a statement of confidence, and Citi upped its rating on the bank's stock to "Buy" from "Hold.” The stock is down about 37% year-to-date.

  • Some 80% of deposits are FDIC-insured, compared to 93% of SIVB's deposit NOT being FDIC-insured

  • This past week alone, there was an influx of over $16 billion. I encourage you to read the statement from founder and co-chairman Charles Schwab and CEO Walt Bettinger, issued on Monday, March 13, here. 


The Bottom line:

  • Is this the beginning of another financial crisis like 2008? I do NOT believe so. Our banking system is resilient and well-capitalized. Unlike the financial crisis of 2008, when banks owned subprime mortgage loans and toxic leveraged collateralized loan obligations, today’s banks — thanks in part to the Dodd-Frank Act of 2012 — own the highest quality government bonds on their balance sheets and capital buffers are much larger.  

  • What happened to the collapsed banks’ assets? On March 20, New York Community Bancorp, Inc. (NYCB) bought Signature Bank’s assets, and Signature’s stock rallied over 34%. On March 27, First Citizens Bancshares entered into an agreement with the FDIC to take over Silicon Valley Bank. SIVB’s stock surged 54% — capitalism at work.

  • Is the worst of this recent banking crisis over? I think we have reached peak panic levels, and the worst of the banking crisis is over. This is a situation where a few outlier banks in California had some problems due to mismanagement, and it will take time to repair the damage to consumer confidence. It is not a 2008 GFC redux. However, there’s a chance we will face a deleveraging cycle more like the S & L crisis of the 80’s. Jim Costello, chief economist at data firm MSCI Real Assets, stated in a recent edition of Wealth Management Magazine: “I have seen though work that was done by a colleague at Columbia that came up with an estimate that close to 200 banks may be failing due to the same issues that took down Silicon Valley Bank. You might have an asset/liability issue there and some of them may not make it. But 200 banks across the scope of things is not the same as what we’ve seen in the middle of the Great Financial Crisis.” From 2008 - 2012, the FDIC closed 465 failed banks. How many do you remember? I can only think of the two listed in the above graphic and the Wall Street investment bank bailouts. Higher interest rates and a looming recession always threaten bank loan portfolios and expose weaknesses.

  • FDIC insurance level is $250,000: A married couple with an LLC, C, or S-corp can maintain up to $750,000 in three separate accounts. Make sure you do not have any uninsured deposits. Banks know their customers; you should know your bank’s balance sheet, especially if your business needs to maintain uninsured cash levels.

The Fed is already considering tougher rules for mid-size banks like SIVB. We've learned that mid-size banks below 250 billion (Systemically Important Banks (SIBs) size) can seriously rock the banking system. But new regulations that bank examiners do not enforce cannot protect depositors from mismanagement. It’s also time for bank accounting rules to be revised. Banks have taken advantage of lax accounting rules to goose profits. The value of a bond doesn't change despite management's "balance-sheet switcheroos."

I think we’ll look back on the banking turmoil of the past few weeks and say, “Ok, that was a bit surreal and scary,” and the economy as a whole might move on quickly. However, despite the Federal Reserve’s backstop of banks, the economic brakes for the economy have been triggered and we could be in for a bumpy ride.


*Note: Cambridge Wealth Management’s portfolio positioning is very defensive, and did not have exposure to regional banks prior to March 2023. However, CWM might have had inconsequential positions held indirectly through the underlying portfolios of the registered investment companies in certain product offerings. Updates to portfolio strategy will be discussed in the private client quarterly performance report.

IMPORTANT DISCLOSURES: This information is educational in nature and is not intended to provide specific investment advice, a financial promotion, or an inducement ,or incitement to participate in any product, offering, or investment. Cambridge Wealth Management is not adopting, making a recommendation for, or endorsing any investment strategy or particular security. The opinions and information expressed herein are obtained from sources believed to be reliable. However, their accuracy and completeness cannot be guaranteed. All data is driven from publicly available information and has not been independently verified by Cambridge Wealth Management, LLC. Some of the conclusions in this report are intended to be generalizations. Any economic forecasts and statements set forth may not develop as predicted and are subject to change. Undue reliance should not be placed on such statements because, by their nature, they are subject to known and unknown risks and uncertainties. There is no assurance that the views or strategies discussed are suitable for all investors or will yield positive outcomes. Investing involves risks including the risk of possible loss. Past performance is not a guarantee of future results.

Q3 2020 Market Review & Outlook: Expect the unexpected

Bull & Bear with masks.jpg

The market’s better-than-expected V-shaped recovery since the spring lockdown was derailed briefly by a September correction that approached 10% in many mega-cap momentum stocks. The S&P 500 index advanced 8.9% and the Wilshire 5000 total market index of U.S. stocks gained 5.54% through Q3.

Outlook: 3 Things to Watch:

As one thinks about the next few months and into 2021, the economy’s outlook is complicated by the election, the path of the pandemic, and the stalemate over the passage of another fiscal stimulus program. Election uncertainty is going to be the dominant issue over the next few weeks.

  1. Election 2020: Déjà vu?:

A Biden presidency and potential Democratic sweep would likely mean higher corporate taxes and higher taxes on investment gains. However, a Democratic boost in federal spending could offset any downside from tax hikes and more regulation, according to many Wall Street strategists.

Trump’s business and brief political history has proven that he’s resilient and has Teflon qualities. And, he could surprise the political pundits again in 2020. The race is still too close to call, and there is a very high risk the election could be unresolved on Election Day — markets would not react favorably to that sort of chaos.

Many of Wall Street strategists believe the current price action in markets is signaling a blue wave. Despite all the theories about the markets’ remarkable V-shaped recovery rooted in political bias, markets are apolitical. They care more about who’s in charge at the Federal Reserve Bank. Indeed, price action has been driven by a supportive Fed coupled with the CARES Act.

As we witnessed in 2016, market players are not particularly good at forecasting how the market will react if a Democrat or Republican wins. History shows that the market will likely do better with two more years of gridlock, no matter who wins the White House.

2. Covid-19 Vaccine:

The year 2020 has been filled with numerous surprises no fiction writer could have contrived. There is still the risk that the second wave of Covid-19 will hit the nation at some point, but the market’s price action does not indicate a willingness to embrace a pessimistic view. It seems that the market is anticipating an effective vaccine, which will likely prevent another shutdown, like the one we saw in the spring. Until a safe vaccine is developed and available, the consumer will be reluctant to spend and travel. Many biotech analysts believe a vaccine could be 80 - 90% effective, worst case 70%. According to market veteran Art Cashin of UBS, the markets may be far too complacent in believing that a highly effective vaccine is imminent. Only time will tell.

3. Stimulus:

The U.S. CARES Act proved to be financially beneficial to those impacted by the pandemic shutdown. But the U.S. economy needs another jolt after suffering through the pandemic, and it cannot recover without it. The Fed has done its job on the monetary side. Its quick and aggressive efforts provided necessary stimulus and liquidity to keep the economy from falling into a deep depression. At $7 trillion, the Fed's balance sheet is bloated, and it cannot stimulate growth and the economy — it can only buy time and provide a floor for market volatility.

In a morning note on October 19, 2020, Joe Weisenthal, an editor at Bloomberg wrote: “This has got to be one of the prime lessons of 2020: When it comes to economic outcomes, the state (at least in the developed world) is incredibly powerful. When the virus came and threatened to obliterate household income this spring, Congress moved quickly and passed the CARES Act — spending trillions of dollars to make up for that. Today, both household net worth and total retail sales are above pre-crisis trends.”

Picture1.png

The second round of stimulus will represent nearly 10% of our annual GDP and turbocharge the recovery. However, neither side seems genuinely interested in helping the economy or the people. It seems they fear the optics of giving the other side a “win” so close to the election. Democrats have been seeking $2.2 trillion in new stimulus, and Senate Republicans have said they would hold new spending closer to $1 trillion. President Trump has offered $1.8 trillion, and it was rejected yet again by Speaker Pelosi.

Stocks & Bonds:

Corporate Earnings:

Due to the pandemic, corporate America is leaner, and it should lead to strong Q3 earnings for many companies outside the oil patch. Quarterly results over the next month and a half will give institutions a chance to decide whether it's time to take profits or put cash back to work and build larger positions.

In a recent Investor’s Business Daily (IBD) article by David Saito-Chung, he quotes a daily note from Steven Ricchiuto, chief economist at Mizuho Securities USA: "These quarterly estimates imply a full-year decline of 18.6%. The same bottoms-up estimates look for a 25.7% rebound in earnings next year. Earnings per share are expected to total $127.70 this year and $165.12 next year. The implied multiple of 25.9x this year is generally seen as compressing to 21.5x in 2021,"

Note: Current lofty valuations in the market can only be justified in the context of a zero interest rate policy (ZIRP), and many stocks, especially technology names, are vulnerable should interest rates start to move higher. Further, Biden’s plan to hike corporate tax will hit earnings. Lower earnings combined with lower multiples isn’t a great formula for higher share prices.

Bond Market: Keep an eye on interest rates.

Real U.S. interest rates (adjusted for inflation) are now negative. The election could impact the bond market, and the make-up of the Senate is a key. Let’s suppose former vice president Joe Biden is elected, and the Senate turns to Democrat control. In that case, markets expect stimulus spending to be much greater leading to a weaker dollar and yields. A weaker dollar would usually be a positive catalyst for equities, particularly large-cap multinationals and energy-based commodities.

Many hedge funds are currently short the dollar, meaning they expect it to weaken in the year ahead. What if they’re on the wrong side of the trade and we begin to experience a stronger dollar?

The yield on the benchmark U.S. Treasury 10-year bond spiked to 0.84% this past week. That marked the highest level since early June. The Fed would like to boost inflation, and they may get their wish, depending on the outcome of the election. An economic recovery is in the future and it’s something that could push yields higher. If we move into a higher inflationary environment, both equities and bonds can go down as bond yields move up. In my opinion, we will eventually get inflation because the Fed’s action has assured it. The big question is: Will job creation and solid growth accompany it, or will we end up with stagflation (no growth and inflation)?

The Bottom Line: Brace for the unexpected

The S&P 500 has been corralled at 3,200 to 3,400 for four weeks. The index moved lower on headlines after the first presidential debate and Trump’s positive Covid-19 test, and each time it has bounced from around 3,300. The S&P 500 closed at 3465.39 on Friday, October 23. The markets are coiling and compressing as they process unexpected events and political election intrigue, building up energy for eventual release, up or down.

Right now, the market is "hoping" that we have a stimulus deal and effective vaccine, but there is a good chance that we do not get either one for some time, at least until after the election. Many market participants are overhedged due to concerns over the second wave of COVID-19, a failure in stimulus negotiations, and election outcomes. As such, we have not witnessed a period of sustained selling pressure. And, the Fed’s aggressive action to help support asset prices have helped dampen volatility.

The VIX (Volatility Index)

One last thought: Will China make good on its promise to purchase $200 billion in U.S. goods, guaranteeing an export boom in 2021? President Trump’s much-touted trade deal has crashed and burned with the Pandemic. His promise to protect American workers from China’s trade practices resonated politically and was almost certainly a decisive factor in his surprising victory in 2016. Under the phase one deal signed in January 2020, China pledged to buy $200 billion of U.S. goods over the next two years, including about $50 billion in two years for oil and gas; $80 billion for engineering equipment; and $32 billion in agricultural products. Since jetliners are the biggest U.S. manufactured export to China, a high-profile Boeing jet purchase would undoubtedly be involved. According to the latest numbers from the Petersen Institute for International Economics: “Through August 2020, China’s year-to-date total imports of covered products from the United States were $56.1 billion, compared with a prorated year-to-date target of $115.1 billion. Over the same period, US exports to China of covered products were $47.6 billion, compared with a year-to-date target of $95.1 billion.”

The markets are banking on a significant reopening of the economy beginning in the first quarter of 2021, with more expansion in the second quarter. Earnings estimates reflect that optimism: S&P 500: 2021 earnings (year-over-year estimates), Q1: up 14%, and Q2: up 44%.

CWM portfolios hold higher cash levels relative to their benchmark model allocations, at this juncture, given my cautious position towards risk assets. For now, the economy’s outlook is complicated by the election, the path of the virus and vaccine news, and a fiscal stimulus program on hold.

IMPORTANT DISCLOSURES: This information is educational in nature and is not intended to provide specific investment advice, a financial promotion, or an inducement ,or incitement to participate in any product, offering, or investment. Cambridge Wealth Management is not adopting, making a recommendation for, or endorsing any investment strategy or particular security. The opinions and information expressed herein are obtained from sources believed to be reliable. However, their accuracy and completeness cannot be guaranteed. All data is driven from publicly available information and has not been independently verified by Cambridge Wealth Management, LLC. Some of the conclusions in this report are intended to be generalizations. Any economic forecasts and statements set forth may not develop as predicted and are subject to change. Undue reliance should not be placed on such statements because, by their nature, they are subject to known and unknown risks and uncertainties. There is no assurance that the views or strategies discussed are suitable for all investors or will yield positive outcomes. Investing involves risks including the risk of possible loss. Past performance is not a guarantee of future results.

INDEX DESCRIPTIONS:
The following descriptions, while believed to be accurate, are, in some cases abbreviated versions of more detailed or comprehensive definitions available from the sponsors or originators of the respective indices. Anyone interested in such further details is free to consult each such sponsor’s or originator’s website. Each index reflects an unmanaged universe of securities without any deduction for advisory fees or other expenses that would reduce actual returns, as well as the reinvestment of all income and dividends. An actual investment in the securities included in the index could require an investor to incur transaction costs, which would lower the performance results. Indices are not actively managed and investors cannot invest directly in the indices.

S&P 500®: Standard & Poor's (S&P) 500® index. The S&P 500® Index is an unmanaged, capitalization-weighted index designed to measure the broad U.S. economy's performance through changes in the aggregate market value of 500 stocks representing all major industries.

COVID-19 Investment Playbook – CWM Special Report

Market corrections happen, but the speed of this decline was the fastest 10%+ one since the Great Depression. The extreme whipsaw moves we witnessed occurred because the market is attempting to reprice risk assets based on outcomes ranging from a brief pause in Q2 economic growth to a global pandemic and recession.

Summary

  • While economic risks are rising, I do not believe the U.S. is heading for a recession or prolonged bear market. Given the risks to Q2 earnings, I am lowering our S&P 500 year-end target from 3400 to 3200.

  • The market was overvalued in certain areas as I stated in our Market Outlook: Investment Themes for 2020, but valuations are not as stretched as they were during the housing bubble and dot-com era. This is not a 2000- or 2008-style correction.

Don’t bet against the Fed

As my brother Michael, an astute economist, stated on March 1: “We are witnessing a supply-driven shock that the world has never experienced before. There’s no playbook for this one.” The novel COVID-19 virus continues to spread outward from China causing widespread fear. The good news is that the Fed and other central banks were proactive, instead of reactive, and moved this past week to stabilize markets by providing additional liquidity. However, it’s not enough. The Fed and the Whitehouse need to embrace a "whatever it takes" mentality. Trading algorithms need to shift from “what if” to “what will” scenarios and this requires a clear plan from our government.

Some market pundits have criticized the Fed’s recent move because they believe monetary policy cannot cure a non-financial “black swan-type” event. However, lower rates will help interest rate-sensitive companies refinance debt — companies that otherwise could find themselves in violation of debt covenants. There are trillions of dollars of debt owed by businesses and refinancing could help a company weather the current storm, potentially taking advantage of opportunities as animal spirits get stirred.

Collapsing oil prices, empty malls, and idling airplanes will have cash flow implications, which could lead to a slowdown in business spending and bankruptcies. However, it’s an overreaction by markets to assume that the global downturn caused by a supply-driven shock and Wuhan virus could lead to a major credit event.

Corporate Profits

Corporate profits likely will come under severe pressure around the world in the months ahead. The sudden oil price collapse and bond market are signaling a global recession. Many market participants fear that we could see more market capitulation in the near-future as Wall Street analysts lower their estimates.

Analysts had conservative forecasts heading into 2020. I noted in Market Outlook: Investment Themes for 2020 that, according to FactSet Earnings Insight, January 10, 2020, “Targets & Ratings: Analysts Project 6% Increase in Price Over Next 12 Months. The bottom-up target price for the S&P 500 is 3,474.50.

Valuations: Cheap or trapdoor?

Investors may be wondering whether the pullbacks represent buying opportunities or a “value trap” that could lead to more losses. While valuations are more attractive than they were a few weeks ago, it’s a secondary consideration to economic fundamentals, which continue to deteriorate.

I continue to reevaluate tactical positions in light of these current weakening fundamentals. Certain investment themes and names that I liked a month ago look even more appealing now. However, longer-term shocks to supply-and-demand could lead to lower valuations for stocks as investors discount future earnings more aggressively due to persistently slower growth.

Strategy and outlook

Time vs. timing the market

We could remain in a choppy market environment for months. Cambridge model portfolios held high cash positions relative to their strategic asset allocation heading into this market meltdown.

I stated in Market Outlook: Key Investment Themes for 2020 that the market was overvalued and current exuberance needed a healthy dose of reality. However, positioning portfolios to their fully invested strategic asset allocation will depend on the containment of the COVID-19 virus over the coming weeks, improving market fundamentals, and a coordinated, clear plan from the White House.

JP Morgan’s global asset strategist, Marko Kolanovic, said in a note to clients on Wednesday: “The hit to the global economy during the first quarter will largely be made up later in the year. The world economy will bounce back quickly from the coronavirus outbreak, and investors should buy into cyclical stocks to catch the comeback.” Indeed, when we do see an eventual rebound, I believe deep cyclical sectors and value styles could outperform.

Market bottoms are impossible to time. But, if one focuses on buying great assets at discounted prices while balancing risk and return, Cambridge Wealth Management’s clients will benefit in the long run.

IMPORTANT DISCLOSURES: This information is educational in nature and is not intended to provide specific investment advice, a financial promotion, or an inducement or incitement to participate in any product, offering or investment. Cambridge Wealth Management is not adopting, making a recommendation for or endorsing any investment strategy or particular security. The opinions and information expressed herein are obtained from sources believed to be reliable. However, their accuracy and completeness cannot be guaranteed. All data is driven from publicly available information and has not been independently verified by Cambridge Wealth Management, LLC. Some of the conclusions in this report are intended to be generalizations. Any economic forecasts and statements set forth may not develop as predicted and are subject to change. Undue reliance should not be placed on such statements because, by their nature, they are subject to known and unknown risks and uncertainties. There is no assurance that the views or strategies discussed are suitable for all investors or will yield positive outcomes. Investing involves risks including possible loss of principal.

INDEX DESCRIPTIONS:
The following descriptions, while believed to be accurate, are in some cases abbreviated versions of more detailed or comprehensive definitions
available from the sponsors or originators of the respective indices. Anyone interested in such further details is free to consult each such sponsor’s or originator’s website. Each index reflects an unmanaged universe of securities without any deduction for advisory fees or other expenses that would reduce actual returns, as well as the reinvestment of all income and dividends. An actual investment in the securities included in the index could require an investor to incur transaction costs, which would lower the performance results. Indices are not actively managed and investors cannot invest directly in the indices.

S&P 500®: Standard & Poor’s (S&P) 500®) index. The S&P 500® Index is an unmanaged, capitalization-weighted index designed to measure the performance of the broad US economy through changes in the aggregate market value of 500 stocks representing all major industries.

Market outlook: Investment Themes for 2020

Tokyo Bay

Tokyo Bay

A year ago, few could have imagined the S&P 500 delivering a gain of more than 31.5% in 2019 (including dividends) with flat earnings. Volatility was extreme in Q4 2018 and a sell-off in December 2018 left the S&P 500 near bear market territory (defined as a 20% decline from its closing peak). Accounting for compounding returns, the near 20% decline suffered by the S&P 500 in Q4 2018 required a 25% rebound to get back to even.

Throughout 2019, we went from concerns of a bear market to recovery only to have recession fears resurface in the third quarter as trade friction and China’s slowing economy rattled markets. We began Q4 2019 at about S&P 500 2930 level — the market treaded water, so to speak, for nearly 18 months.


2019 performance for key indices:

Equity market:

• S&P 500: 31.5% (including dividends)
• MSCI EAFE: (index of developed market economies): 22%
• MSCI Emerging Markets Index: 18.5%

Bond market:

• Barclays U.S Aggregate Index: 8.7%
Intermediate-term municipal bonds: 5.7%

Real assets:

• Spot gold returned 18.5%.
• REITs gained more than 20%.
Note: UBS tracks 18 asset classes to include in its year-end investor report, and all asset classes reported positive returns compared to only two in 2018 (cash and bonds).

Apple and Microsoft accounted for nearly 15% (almost half including dividends) of the S&P 500 index returns in 2019.

Top Contributors_2019.png


A change of heart at the Fed

So, what changed to finally break the market’s range-bound movement? Our president stopped tweeting about the U.S.- China trade war. Seriously: Much of the stock market’s gains in 2019 can be attributed to a dramatic policy shift at the Federal Reserve.

In 2018, the Fed raised rates four times, including a December 2018 hike that took its key rate to 2.5%, sending a major shockwave throughout global markets. However, in 2019, the Fed lowered rates three times, in one-quarter percentage point steps, due to concerns over a slowing global economy tied to trade war concerns and lackluster business spending. And for an added safety measure, the Fed announced the buying of Treasury bills in September to stabilize the short-term repo market. The Fed’s intervention injected the market with an extra boost to liquidity and investor confidence.

GDP Chart.png

Gross domestic product (GDP) in the U.S. is expected to slow to about 2.0% in 2020, down from 2.2% in 2019 and well off the “sugar highs” induced by the 2017 tax cut package.


Trade deals Signed

We spent much of the year being whipsawed by the U.S.- China trade war headlines and our president’s erratic tweets on the subject.

As the year came to a close, the House passed the United States-Mexico-Canada Agreement, which is President Trump’s replacement for NAFTA. Equally important, the Trump administration came to a phase-one trade agreement with China. All in all, very welcome news for markets.

Trump’s China tariffs and the uncertainty surrounding them were troubling U.S. businesses that have built supply chains in China or that rely on Chinese imports. Their concerns were a reason U.S. businesses’ capital investment fell throughout the year.

pmi_vs_sp500_2019.png


Looking ahead: Key themes for 2020

Corporate earnings: Paying up

As we enter 2020, markets are riding high. Indeed, the mood is ebullient as we experience a continued “melt-up” in markets. The market rally has been driven by expectations of a snap-back in earnings growth and a synchronized global economic recovery.

Price/earnings (P/E) ratios rose to 18.3 forward earnings for the S&P 500 from 15.6 a year ago. The P/E multiple expansion resulted from a decline in interest rates. Are markets expensive? Multiplying the current P/E of 18.4 times the consensus S&P earnings estimate for 2020 of $177.88 results in an index level of 3,202. Based on these forecasts, the market is overvalued at current levels.

According to FactSet Earnings Insight, January 10, 2020:
Targets & Ratings: Analysts Project 6% Increase in Price Over Next 12 Months. The bottom-up target price for the S&P 500 is 3474.50. At the sector level, the Energy (+12.7%) sector is expected to see the largest price increase, as this sector has the largest upside difference between the bottom-up target price and the closing price. On the other hand, the Information Technology (+1.7%) sector is expected to see the smallest price increase.”

Earnings growth estimates were down drastically this past year. Analysts estimated S&P 500 earnings growth for the year would be around 7.6%, according to FactSet. That number is now about 0.3% or flat.

A key theme to watch in 2020 will be companies ability to continue to grow earnings and meet current expectations.

Portfolio implications for 2020:
Sector profit margins at risk of earning misses are Consumer Staples, Industrials, Technology, Consumer Discretionary, and Basic Materials sectors where 25% tariffs on $250 billion array of Chinese industrial goods and components used by U.S. manufacturers remain in place. Note: The fierce rotation into value that began in September, led by major banks like JP Morgan (a beneficiary of the U.S.-China Trade deal) still has room to run.

Some key earnings forecasts to watch this month: Apple, Amazon, and Boeing.
The market has bid up Apple shares, anticipating strong growth from Services. Some analysts are predicting production cuts in March for the iPhone 11 line (iPhone 11 Pro retails for $1149) in Chinese markets due to low demand and increasing headwinds from aggressive 5g smartphone launches in China by Huawei. Apple has fallen behind Asian competitors in its 5g product launch.

Deglobalization or Fair Trade?

What began as campaign rhetoric became reality when president Trump announced his trade reform agenda at the World Economic Forum at Davos in January 2018. He stated: “The United States will no longer turn a blind eye to unfair economic practices, including massive intellectual property theft, industrial subsidies, and pervasive state-led economic planning. These and other predatory behaviors are distorting the global markets and harming businesses and workers, not just in the U.S., but around the globe…The United States is prepared to negotiate mutually beneficial, bilateral trade agreements with all countries.

A phase-one trade deal is important from a psychological perspective because it removes some of the fog of uncertainty clouding business activity for the current fiscal year. A phase-two trade deal with China will not be negotiated until after the 2020 elections. Going forward, we should see a pickup in capital expenditures.

Overseas, growth continues to be more challenging than in the U.S, but green-shoots are emerging and valuations are attractive. The U.K. is expected to negotiate a favorable trade agreement with continental Europe and a soft-landing for Brexit is now widely anticipated.

Portfolio implications for 2020
Trade wars, tariffs, and talk of more tariffs have created a cautious business atmosphere, restraining investment, and concomitant global growth. While a phase-one deal has provided clarity for businesses, trade will remain a top policy issue throughout 2020 and beyond.

In November 2019, the FCC labeled Huawei and ZTE a national security threat and cut Federal funding going to equipment from these companies. Huawei, now the world’s largest telecommunications equipment manufacturer and second-largest smartphone manufacturer, is currently appealing the ban, deeming it unconstitutional. Additionally, the Trump administration has banned U.S companies from doing business with Huawei. In November, the U.S gave Huawei a third 90-day support window that allows current Huawei customers to continue to receive support for existing devices from U.S companies who apply for a “general export license.” The U.S. is also requesting Meng Wanzhou, Huawei’s CFO, be extradited and tried for fraud.

Huawei map.png

Countries and companies that rely heavily on exports who adapt quickly to this changing trade dynamic as they plan capital expenditures and rethink their supply chains will fare better than those who don’t. Earnings for Google Mobile Services(GMS) and certain semiconductor manufacturers could be negatively impacted should the U.S. fail to grant Huawei a fourth 90-day support window. Note: Chinese companies stockpiled U.S. semiconductors in 2018, but inventories are now running low. Huawei is developing their own mobile services, called HMS, to replace Google.

The Fed and Central Banks: On hold?

It appears the recent rate cuts by our Fed have been enough to extend the economic cycle. Bond yields generally remain in their lowest decile relative to history thanks to easy monetary policy and subdued credit conditions. While the Fed is usually on hold during an election year, it may be forced to cut rates again due to concerns over a slowing economy and cautious business spending.

Portfolio Implications for 2020
Interest rates should remain range-bound with the 10-year U.S. Treasury bond trading between a yield of 1.75% and 2.0%. The current rate environment will continue to support an elevated P/E ratio of 18. Companies should continue to take advantage of low rates and buy back shares of their stock, helping boost prices as supply is reduced. Unlike the rally in 2019, Bond returns will likely remain constrained due to dovish central banks and soft global growth. Investors should stick with investment-grade corporates for taxable accounts and avoid reaching for yield this late in the cycle.

U.S. Elections: Facebook, Google, Healthcare, and Energy in focus

First, a word about impeachment. The consensus view is that the current situation is similar to president Bill Clinton's impeachment in 1998, which didn’t affect markets. Perhaps the current impeachment proceeding is more about the Democrats taking control of the Senate? Four Republican senators are at risk: Martha McSally (Arizona), Cory Gardner (Colorado), Joni Ernst (Iowa), and Susan Collins (Maine).

As always, the big wild card to market forecasts this year will be the 2020 elections, though markets likely won’t focus on this X-factor until June. I should note, even though the market’s performance has generally been positive in election years, the gains usually come later.

Many things are going right. With central banks now acting in sync with each other and new trade deals in place, talks of a synchronized global recovery have resurfaced. Improving corporate earnings, business confidence, and an accommodative Fed should help drive market gains in 2020. In all, I expect a good year for financial markets, but as always, I’m prepared for the inevitable surprises that could impact my outlook. Trade frictions with China centered on Huawei and their CFO could heat up again in March as business support exemptions expire, giving current exuberance a healthy dose of reality.

IMPORTANT DISCLOSURES: This material is for general information only and is not intended to provide specific advice or recommendations for any individual. The opinions and information expressed herein are obtained from sources believed to be reliable. However, their accuracy and completeness cannot be guaranteed. All data is driven from publicly available information and has not been independently verified by Cambridge Wealth Management, LLC. Opinions expressed are current as of the date of this publication and are subject to change. Some of the conclusions in this report are intended to be generalizations. There is no assurance that the views or strategies discussed are suitable for all investors or will yield positive outcomes. Investing involves risks including possible loss of principal. Any economic forecasts set forth may not develop as predicted and are subject to change.

INDEX DESCRIPTIONS:
The following descriptions, while believed to be accurate, are in some cases abbreviated versions of more detailed or comprehensive definitions
available from the sponsors or originators of the respective indices. Anyone interested in such further details is free to consult each such sponsor’s or originator’s website. Each index reflects an unmanaged universe of securities without any deduction for advisory fees or other expenses that would reduce actual returns, as well as the reinvestment of all income and dividends. An actual investment in the securities included in the index could require an investor to incur transaction costs, which would lower the performance results. Indices are not actively managed and investors cannot invest directly in the indices.

S&P 500®: Standard & Poor’s (S&P) 500®) index. The S&P 500® Index is an unmanaged, capitalization-weighted index designed to measure the performance of the broad US economy through changes in the aggregate market value of 500 stocks representing all major industries.

Q4 2018 Market Update: The Start Of A New Crisis?

Bearish or Bullish.jpg
A speculator is a man who observes the future, and acts before it occurs.
— Bernard Baruch

The stock market lost nearly 2 trillion during the October sell-off, with the major averages hitting multi-month lows. The sell-off was induced by cautious earnings guidance, concern over China’s economic outlook, as well as higher borrowing costs for businesses due to rising interest rates. It's a replay of what happened in the first-quarter reporting season, when firms reporting solid financial performance sold off upon the announcement of earnings reports. As I stated in U.S.- China trade wars: Could it get any uglier? “The market conditions that led to February’s spike in the VIX (CBOE Volatility Index) — rising rates, less liquidity, and hedge funds being caught wrong-footed — are still there.”

In Brief

  • The big question on investors’ minds: How durable is global growth over the next several years?

  • S&P 500 companies are seeing the worst price reaction to positive EPS surprises since Q2 2011. According to John Butters of Fact Set, October 28, 2018.

  • Q3 2018 may likely mark the peak in double digit earnings growth as the effects of tax cuts and regulatory rollbacks are set to wane, but it’s not peak earnings — economic output is still growing.


The U.S. Stock Market: Profit margins at risk?

US Market_Profit margins.png

As they have done throughout 2018, companies are reporting mostly good financial results for the third quarter. The October sudden flare-up of selling pressure was fueled, in part, by below-consensus earnings guidance from high profile companies. During this reporting season, CEO’s have been talking about the challenges they face with rising production costs and relatively new tariffs. This only served to increase investors’ growing concerns about a looming recession. Recent company comments revealed fears that the U. S. - China trade wars are leading to business uncertainty as U.S. multinationals’ lower forward earnings guidance. The hardest hit sector was technology. The beloved F.A.N.G. titans (Facebook, Amazon, Netflix, and Google) were clobbered in October, perhaps signaling a shift in market leadership for the most crowded trade in the equity universe. 

While it looks to be the end of double-digit earnings per share gains due to the Trump tax cuts, the S&P 500 is still expected to yield a 9.3% gain in 2019. Peak earnings growth implies that earnings will continue to grow, but at a slower pace. It does not mean earnings have peaked.

Note: The UBS daily corporate liquidity signal shows that the combination of buybacks and dividends will more than triple over the coming weeks, "rising to a weekly pace of $48 billion by mid-November as earnings are announced and blackouts end."

The U.S. Bond market

Investors are pouring their money into bonds and it’s understandable given recent market jitters. At the time of this writing, the 2-year Treasury bond is yielding almost 2.9% for the first time in years. Two big questions on the minds of investors are:

  • How durable is global growth over the next several years?

  • Can the economy can withstand a string of new rate hikes?

In January’s market views on 2018, I stated: “Much of the Fed's policy this year will be influenced by what other central banks decide. Given that both the European Central Bank and the Bank of Japan continue to be plagued by low inflation, the Fed will likely tighten three times in 2018 with a median estimate for federal funds rate at 2.1%. The pace of “quantitative tightening” and the market's reaction will be an important factor not only for credit markets but also for equity markets in 2018.” 

The data is telling the Fed to rethink their “auto-pilot” rate hiking agenda. While the market anticipates a fourth hike in December, I think the Federal Reserve Bank will hit the pause button on its path back to “normal” monetary policy given the global economic environment. Thus, I believe the flattening yield curve should begin to steepen again by year-end - a healthy sign for continued growth in U.S. markets.

Cambridge Insight: Junk bond yields have not widened at this juncture, signaling default concerns, as they did in 2007 prior to the Great Recession of 2008.

The Bottom Line:

Consecutive Market Losses_10.2018.png

The market bloodletting during October represents the readjustment in earnings over the coming year due to challenging year-on-year earnings per share comparisons. Additionally, dark clouds are forming over the global economy due to geopolitical uncertainty — Brexit is increasingly looking like a disaster, and the trade war with China seems set to worsen. Add to this list concerns over midterm U.S. elections, and there’s a very real prospect that over the next 12 months — the world’s two largest economies — the United States and China, could slow.

The Trump administration is engineering significant changes at home and abroad that represent sharp revisions of direction from traditional American positions. Chicago billionaire real estate investor, Sam Zell, recently commented that government regulators seem to have adopted a more business friendly approach, and as such, investors are more willing to take on risk. On trade, President Trump's approach to negotiations has produced favorable new trade agreements with Canada, Mexico, and South Korea. Hopefully, China follows South Korea’s example and agrees to cut their large trade surplus with the U.S. and rebalance a relationship that has served them so well.

The current market environment calls for a cautious approach. However, there are a number of “turnaround triggers” that could help boost the market and my confidence over the next year:

  • Meaningful progress in the U.S.- China trade war, and

  • The Federal Reserve reversing its intentions to continue raising interest rates.

Lastly, regardless of midterm election outcomes, the markets have historically experienced a 7% post-election surge. However, during the Trump era, old playbooks don’t apply. The latest decline ultimately should not compromise the integrity of the bull market. A fundamental reason for stating this is that corporate earnings growth remains on a positive trajectory given the current administration’s market friendly policies. Jamie Dimon, CEO of JP Morgan, said in a media conference call following his bank's recent earnings report, “The economy is still very strong, and that's across wages, job creation, capital expenditure, consumer credit; it's pretty broad-based, and it's not going to be diminished immediately." I’ll take Jamie Dimon at his word.


SOURCES:
Wall Street Journal Online; Bloomberg News; Investor’s Business Daily; Forbes.com; CNBC News; Reuters News;

The information contained in this piece is intended for information only and should not be considered investment or tax advice. Please contact your financial adviser with questions about your specific needs and circumstances. Nothing contained herein shall constitute a solicitation, recommendation or endorsement to buy or sell any security. The information and opinions expressed herein are obtained from sources believed to be reliable, however their accuracy and completeness cannot be guaranteed. All data are driven from publicly available information and has not been independently verified by Cambridge Wealth Management, LLC. Opinions expressed are current as of the date of this publication and are subject to change. Certain statements contained within are forward-looking statements including, but not limited to, predictions or indications of future events, trends, plans or objectives. Undue reliance should not be placed on such statements because, by their nature, they are subject to known and unknown risks and uncertainties.

INDEX DESCRIPTIONS:
The past performance of an index is not a guarantee of future results.

The following descriptions, while believed to be accurate, are in some cases abbreviated versions of more detailed or comprehensive definitions available from the sponsors or originators of the respective indices. Anyone interested in such further details is free to consult each such sponsor’s or originator’s website.

An index reflects an unmanaged universe of securities without any deduction for advisory fees or other expenses that would reduce actual returns, as well as the reinvestment of all income and dividends. An actual investment in the securities included in the index could require an investor to incur transaction costs, which would lower the performance results. Indices are not actively managed and investors cannot invest directly in the indices.

S&P 500®: Standard & Poor’s (S&P) 500® Index. The S&P 500® Index is an unmanaged, capitalization-weighted index designed to measure the performance of the broad US economy through changes in the aggregate market value of 500 stocks representing all major industries

U.S.-China Trade War: Could it get any uglier?

A day will come when there will be no battlefields, but markets opening to commerce and minds opening to ideas.
— Victor Hugo

Trade tensions between the United States and China show no signs of simmering down. A new round of U.S. tariffs on Chinese imports kicked in on August 22. The U.S. began collecting an additional 25 percent in duties on $16 billion in Chinese import product categories including semiconductors, chemicals, and motorbikes, just to name a few. These latest American tariffs come on the heels of $34 billion in Chinese goods duties levied at 25 percent, which were implemented in July.

Beijing immediately retaliated with tariffs of their own on $16 billion worth of additional imports from the U.S. including fuel, steel products, autos, and medical equipment.
 

In brief:

  • Basic materials, industrials, and emerging markets have all taken a hit in recent months due to the trade wars. Turbulence will be around for awhile particularly in emerging markets.

  • Markets should expect bilateral tit-for-tat trade actions to continue for the foreseeable future for both the U.S. and China. With approaching midterms, China is playing a waiting game.

  • The objective is to reduce the size of the U.S. - China trade deficit from an estimated $370 billion to $200 billion by 2020 and eliminate unfair trade practices noted below.

August 6, 2018 - prior to recent round of 16b in tariffs

August 6, 2018 - prior to recent round of 16b in tariffs


The issues:

At the core of the trade war issues on the U.S. side are concerns over technology infringement and alleged widespread intellectual property (IP) theft by the Chinese. This comes from three activities:

  • Corporate espionage,

  • Cyber-theft, and

  • Technology transfer to the Chinese in exchange for market access.

The Commission on the Theft of American Intellectual Property estimates that China's purported IP theft costs the U.S. between $225 billion and $600 billion each year. http://ipcommission.org

China has denied Washington's allegations that it essentially forces the unfair transfer of U.S. technology in exchange for market access and insists it adheres to World Trade Organization rules.

Instead of tit-for-tat trade tariff retaliation with the U.S., China should follow South Korea's lead and accept to bring down their large surplus on American trades and rebalance a relationship that has served them so well.


The art of the deal

The prevailing wisdom on President Trump's trade tactics is that he's making major negotiation errors in his attacks on China and that nobody can win a trade war. Regardless of the Trump administration’s current trade war strategy with China, I think that things could change quickly for China in the coming months leading to two very different potential market outcomes in Q4. China wants U.S. business interests to pressure President Trump, and it’s betting on scenario one below.

Scenario 1: A “Blue Wave” in the House this November gives the Democrats a mandate to impeach Trump if the Special Counsel report proves some form of perjury or Russian collusion. President Trump is likely to survive indictment in the Senate, but "Never Trump" Republicans could vote to replace him with Vice President Mike Pence. Note: The billionaire Koch brothers have financed the Vice President’s political career, and therefore, he would likely carry their “free trade” globalist torch.

Scenario 2: The Special Counsel finds no Russian Collusion or wrongdoing by the Trump administration, there’s a “Red Wave” in November midterms, and President Trump is given the mandate to move forward with his populist agenda and impose tariffs on a total of $500 billion of Chinese imports.

So, what’s the real U.S. endgame in this trade war with China? It's this: Redirect global supply chains to favor American manufacturers; pressure China to open its market to Americans with no strings attached; reduce the trade deficit, and challenge Chinese dominance in Asia.
 

The bottom line:

Shangai index 620x-1.png

China's President Xi Jinping is feeling the heat and it looks like he may have overreached. Trade tensions have exposed vulnerabilities in China's slowing economy, and it’s making investors nervous. A tanking Chinese stock market and resulting investment outflows could lead to an uptick in emerging market bond yields and the winter of discontent in China. Even worse, a full-blown trade war would have stagflationary consequences globally.

A few days ago, veteran Wall Street trader Art Cashin of UBS mentioned on CNBC that markets seem to be pricing in the “Pence Put.” A put is a option contract giving the owner the right to to sell a specified amount of an underlying security at a specified price within a certain time frame, limiting downside market risk. Either the market is looking beyond the trade war and midterm elections and pricing in a "Pence Put" or it's having a lagging reaction to significant regulatory rollback and Trump's Tax Cuts and Jobs Act of 2017 (TCJA).

The future is capricious (especially in the Trump era), which is partially the reason why markets exist in the first place. The market conditions that led to February’s spike in the VIX (volatility index) — rising rates, less liquidity, and hedge funds being caught wrong-footed — are still there. With the unprecedented confluence of political and trade events added to these pre-existing conditions, the likelihood of a spike in volatility calls for underweighting equities relative to their strategic asset allocation and holding higher levels of cash. Depending on the outcome of the November midterms and the Mueller investigation, the U.S. - China trade war could get even uglier in the months ahead as trade policy scripts get torn up and rewritten.
 

Sources: Wall Street Journal Online; Bloomberg News; Investor’s Business Daily; Forbes.com; CNBC News; Reuters News; The Economist.

The information contained in this piece is intended for information only and should not be considered investment advice. Please contact your financial adviser with questions about your specific needs and circumstances.

The information and opinions expressed herein are obtained from sources believed to be reliable, however their accuracy and completeness cannot be guaranteed. All data are driven from publicly available information and has not been independently verified by Cambridge Wealth Management, LLC. Opinions expressed are current as of the date of this publication and are subject to change. Certain statements contained within are forward-looking statements including, but not limited to, predictions or indications of future events, trends, plans or objectives. Undue reliance should not be placed on such statements because, by their nature, they are subject to known and unknown risks and uncertainties.

Q2 2018 Update: Volatility is back!

Bearish or Bullish.jpg
The stock market serves as a relocation center at which money is moved from the active to the patient.
— Warren Buffet

After a strong start to the year in January, volatility returned with a vengeance in early February just as our new Federal Reserve chairman, Jerome Powell, took control of the central bank. The entry of a new Fed chairman was followed by two high-profile exits in the Trump administration: economic advisor Gary Cohn and Secretary of State, Rex Tillerson. Markets prefer certainty, and with both Cohn and Tillerson gone, many now believe there isn’t anyone left to keep President Trump in check. Additionally, investors are losing faith in markets as President Trump ramps up his combative anti-trade rhetoric.


In Brief:

  • The 10-year treasury finally hit 3% this week — the first time since the taper tantrum of 2014. Algorithms “sold the news” and set into motion a further sell-off to start Q2.

  • Markets now fear that the Fed will raise rates at least three more times in 2018, pushing the economy into recession in 2019. Contrary to consensus, I believe the Fed will raise rates only twice in 2018 and is under no pressure to aggressively lift interest rates.

  • Many research analysts contend that the boosts from Trump’s tax cuts are largely priced into the market and the highs were made in January. It's easy to factor in new corporate tax rates but future demand expectations are always difficult to forecast. Cambridge Wealth Management’s year-end target for the S&P 500 for 2018 remains 2850.

Picture1.png

Volatility is baaack. In January, I mentioned that the “FAANG Stocks “focus (Facebook, Amazon, Apple, Netflix, and Google) remains a worry for me in 2018. The relentless advance in the market in 2017 was largely fueled by a handful of glamorous mega-caps. In fact, a recent analysis shows that nearly 40% of last year’s gain in the S&P 500 can be linked to just four stocks.” New York Times contributor, Norm Alster, pointed out in a January 12, 2018 article (click): “FAANG stocks made up just 6 percent of the S.&P. 500 in 2013. By the end of last year, they accounted for 12.3 percent.”

As Facebook and Google face the potential for new regulations to protect consumer privacy and prevent suspected foreign intervention in our future elections, volatility in the FAANG stocks has picked up and exacerbated moves to the downside in the market indices. In a September 2017 post on the Cambridge Wealth Management Facebook page, I shared the following quote: "The gross idolatry, or mother of all hall passes, that big tech has received from government and from regulators is coming to an end," NYU Stern School of Business professor Scott Galloway told CNBC's "Squawk Alley.”

Currently, the market is searching for new leadership as the once invincible FAANG Stocks have met their kryptonite: potential government regulations. The prospects of increased regulation for social media companies and tight labor markets are giving investors reason for pause because it means changes in future earnings that result in diminishing risk-adjusted returns. And it couldn’t come at a worse time as the list of political obstacles for the market continues to pile up, such as a potential Democratic sweep in the November midterm elections and a trade war with China. With so much uncertainty, we are simply entering a period of “risk-off” in global markets. We are not entering a recession or a bear market.

According to the Investment Company Institute, outflows from U.S. equity mutual funds and exchange-traded funds totaled $41.3 billion in February. That's the most by a dollar amount since a $42.8 billion outflow in January 2008. So, while earnings are failing to impress investors and the markets show continued signs of volatility, I believe reduced burdensome regulations, lower tax rates, higher wages, improving corporate and personal balance sheets means the market’s best days are in front of us. Just as in Q1 2018, a record number of S& P companies are beating earnings again. Check out these recent numbers published on April 23 by John Butter’s of Fact Set:

“It appears the lower tax rate is more than offsetting any impact of higher wages and other rising costs, resulting in a record-level net profit margin for the index for the first quarter. It is interesting to note that analysts expect even higher net profit margins for the remainder of 2018 for the S&P 500. Based on current earnings and revenues estimates, the estimated net profit margins for the second, third, and fourth quarter of 2018 are 11.5%, 11.8%, and 11.7%, respectively.”

Inflation Concerns

Picture2.png

From 2014 to 2016, inflation expectations tumbled as the oil glut and the Saudi's efforts to drive U.S. producers out of business pushed crude below $30 by early 2016. The recovery in the price of oil helped fuel gains in 2017 but it appears the high is now in for oil and its presenting a headwind for further market gains. Oil should resume its longer-term trend lower over the next few years. The graph above illustrates that inflation concerns over the near-term maybe overblown. However, the headline is changing. For years, our Fed was worried about deflation, and now it’s focus is shifting to inflationary concerns.

Historically, in the late stages of a bull market, the economy shows signs of overheating, inflation continues to climb higher, stock prices look expensive compared to earnings, and the Fed continues to raise rates aggressively. Late-stage cycle sectors to invest in include energy, utilities, healthcare, and consumer staples. Other than a recent surge in energy stocks, healthcare and consumer staples sectors are performing poorly. Therefore, it does not appear that we are in the 7th, 8th or 9th inning of a late-stage bull market (many pundits like to use this baseball terminlogy to describe market cycles). The length of this bull market (as compared to previous bull markets) is an irrelevant comparison.

Famed investor Louis Navellier sums up the performance of the markets since 1999 in a January 2018 Seeking Alpha post titled: “The S&P 500 has gained only 3.4% since 2000.” In it, he notes:

“When pundits talk about the soaring stock market this year, last year, and the last nine years, they forget to mention the nine dismal years before 2009. If you take the full 18 years from the end of 1999 to the end of 2017, the S&P 500 has only risen 82%, which works out to only 3.4% per year, annualized.”

Over the past decade, America has experienced the weakest economic recovery in history. GDP growth averaged 1.26%, worse than the Great Depression’s growth rate of 1.37%! (Granted, not a fair comparison but I thought it was worth noting). There is plenty of room for improvement going forward as American’s experience improved wages for all, not just the top 1%.
 

Fixed Income

Market Milestone_10-yr T @3%.png

A market milestone is reached this week - 3% 10-year treasury

Markets are now concerned that our new Fed chairman, Jerome Powell, will prove to be a “hawk” and aggressively raise interest rates. Many financial experts point to the flattening yield curve as a leading indicator of a looming recession or "soft patch" in 2019. The economy is getting unprecedented fiscal stimulus from the Tax Cut and Jobs Act of 2017 at a time when the Fed is raising rates, and the federal debt has begun spiraling upward.
*For a deeper explanation of the "yield curve tell," check out this piece by me posted in February 2017.

Contrary to Wall Street’s consensus view, I think the Fed will raise rates only two times this year. While inflation, wage growth, and the economy show signs of picking up, it’s not overheating, allowing the Fed to gradually raise rates this year and in 2019.

Additionally, both the European Central Bank and the Bank of Japan are not planning rate hikes, and their buying of our treasuries along with foreign capital seeking better returns could put a lid on further rate increases for the balance of the year.

My view is that the 10-year Treasury yield could rise to 3.5% within a year as the Fed follows a steady and slow path of tightening.

At Cambridge Wealth Management, we continue to favor a short-duration laddering strategy of investment-grade corporate bonds and CDs on the short-end. Investors are finally getting paid to hold CDs as 6-month paper approaches 2%. And select 2023 BBB-rated financial paper is close to yielding 4% again.

Note on Municipal bonds: The new $10,000 limits for deducting state tax against one’s Federal tax makes municipal bonds even more attractive to wealthy individuals living in high-tax states like California, Connecticut, New York, New Jersey, and Maryland. The two categories that look are appealing within the muni space are the top ten U.S. ports and airports.


The Bottom Line:

So far this earnings season, a lower tax rate for corporate America is more than offsetting any impact of higher wages and other rising costs, resulting in a record-level net profit margin. But given the recent breakdown in leadership from the FAANG group, concerns over mistakes by a new Fed Chairman, and ever-changing, worrisome tweets from our president, the market has a reason for pause as it sells the good news and reevaluates risk premia. However, I remain reasonably optimistic on the market with a year-end target of 2850 for S&P 500.

From a technical standpoint, the U.S. market is showing signs of support at S&P 500 2600 and further downside risk seems muted. And if the Trump administration is successful in negotiating better trade deals with China and restructuring the terrible NAFTA deal, I believe the best days lie ahead for corporate America and it's labor force. A cautionary word: As I stated in the Q1 Market Update, current investigations of President Trump may "turn out to be a more significant market risk in 2018 than extended valuations, Fed hikes, trade wars, Iran, or North Korea."

From a valuation viewpoint, the market appears fairly priced and trading at about a price-to-earnings (PE) multiple of 24. A PE of 24 may be seen as pricey compared to historical averages and the Cape-Shiller PE median of 16.7, but I think it’s justified by the current era of very low-interest rates and sub-par GDP growth over the past decade. Year to date, interest rates have risen, and as a result the valuation of stocks, as measured by PE ratios, has dropped. If one calculates PE with the FED Model PE Ratio, a 10-year treasury yield of 3% equates to a fair value ratio of 33 (1.0/.03), which is above where the market PE sits now.
*Check out historical PE ratios here.

Lastly, one thing I’ve learned over the years is that the current level of PE ratios, whether trailing 12 months (TTM) or Shiller, has been shown to be a poor guide to market timing and asset allocation shifts. Many investors missed out on the recent market recovery by applying such a methodology. However, buying and holding a diversified portfolio aligned with your personal risk tolerance and values is the best defense against uncertain markets.

Should you have any questions or concerns, please feel free to contact Cambridge Wealth Management.


Sources:
Wall Street Journal Online; Bloomberg News; Investor’s Business Daily; Forbes.com; CNBC News; Seeking Alpha: Reuters News; New York Times.

The information contained in this piece is intended for information only and should not be considered investment or tax advice. Please contact your financial adviser with questions about your specific needs and circumstances.

The information and opinions expressed herein are obtained from sources believed to be reliable, however their accuracy and completeness cannot be guaranteed. All data are driven from publicly available information and has not been independently verified by Cambridge Wealth Management, LLC. Opinions expressed are current as of the date of this publication and are subject to change. Certain statements contained within are forward-looking statements including, but not limited to, predictions or indications of future events, trends, plans or objectives. Undue reliance should not be placed on such statements because, by their nature, they are subject to known and unknown risks and uncertainties.

INDEX DESCRIPTIONS:
The past performance of an index is not a guarantee of future results.

The following descriptions, while believed to be accurate, are in some cases abbreviated versions of more detailed or comprehensive definitions
available from the sponsors or originators of the respective indices. Anyone interested in such further details is free to consult each such sponsor’s or originator’s website.


Each index reflects an unmanaged universe of securities without any deduction for advisory fees or other expenses that would reduce actual returns, as well as the reinvestment of all income and dividends. An actual investment in the securities included in the index could require an investor to incur transaction costs, which would lower the performance results. Indices are not actively managed and investors cannot invest directly in the indices.

S&P 500®: Standard & Poor’s (S&P) 500®) index. The S&P 500® Index is an unmanaged, capitalization-weighted index designed to measure the performance of the broad US economy through changes in the aggregate market value of 500 stocks representing all major industries.


Q1 Quarterly Update: Cambridge Wealth market views on 2018

3-D Glass Diagram.jpg
Bull markets are born of pessimism, grow on skepticism, mature on optimism, and die on euphoria.
— Sir John Templeton

The current US business cycle is closing in on nine years, which makes it the second-longest bull run of the post-WW II era. Even the most bullish and optimistic investors have been surprised by the strength and resiliency of today’s market.

The impact of the recent tax cut and decreased government regulation on businesses has been welcomed by markets, and soaring business optimism is already translating into nice gains for the market again in 2018. As of January 25, 24% of the companies in the S&P 500 have reported actual earnings and sales numbers for the fourth quarter. Of these companies, 81% have reported sales above estimates and 19% have reported sales below estimates,” according to John Butters of Fact Set.
 

In Brief:

  • Much of the Fed's policy this year will be influenced by what other central banks decide. Given that both the European Central Bank and the Bank of Japan continue to be plagued by low inflation, the consensus view is the Fed will likely tighten three times in 2018 with a median estimate for federal funds rate at 2.1%. The pace of “quantitative tightening” and the market's reaction will be an important factor not only for credit markets but also for equity markets in 2018. See chart at: St. Louis Fed.org.

  • Excessively easy Central Bank monetary policies have led to a world awash in liquidity, leading to overvalued equities. Has peak liquidity met peak positioning in stocks? The price/earnings ratio for the S&P 500 is now 26.8, higher than at any time in the 100 years before 1998 and 70% above its historical average. According to Liz Ann Sonders, Chief Investment Strategist at Charles Schwab, "the danger is that the bar set for investors in 2018 is too high."

  • Markets lead the economy and according to earnings data tracked by Fact Set since 2008, a record number of S& P Companies are beating earnings in Q4 2017. I expect positive returns from U.S. and international markets, with no recession in the foreseeable future. S&P profits should expand by 10% in 2018, having grown 11% in 2017.

U. S. Equity Markets:

Bull Run.png

As the adage says, money goes to where it’s treated best. The tax bill that was passed is already leading to investments in the U.S. by corporations. One needs to look no further than the recent Apple news — the vast majority of the $252 billion of its cash that's held abroad is being brought back to the U.S. According to their press release on Apple.com: “Apple, already the largest U.S taxpayer, anticipates repatriation tax payments of approximately $38 billion as required by recent changes to the tax law. A payment of that size would likely be the largest of its kind ever made. Apple expects to invest over $30 billion in capital expenditures in the U.S. over the next five years and create over 20,000 new jobs through hiring at existing campuses and opening a new one. Apple already employs 84,000 people in all 50 states.”

FAAN(M)G Stocks’ focus remains a worry for me in 2018. The advance in the market in 2017 was largely fueled by a handful of glamorous mega-caps. In fact, a recent analysis shows that nearly 40% of last year’s gain in the S&P 500 can be linked to just four stocks. Historically, narrow advances have tended to be a warning sign: Remember the Four Horsemen of the internet in 2000 - Sun Microsystems, Cisco, EMC, and Oracle? Today, we have the FAANG Stocks. This select group of stocks is made up of Facebook, Amazon, Apple, Netflix, and Google/Alphabet. One could also substitute an old favorite, Microsoft, for Netflix to yield FAAMGs. Note: It took Microsoft over 15 years to reach its old high of $53 set in March 2000 .

Investors have piled into this select group of stocks with strong earnings growth prospects. Earnings disappointments by members of the FAAMGs/FAANGs could lead to a disproportionate impact on index returns in 2018.

On the bright side of things, small-caps and mid-caps broke out of their multi-year malaise's in late September 2017 and are now helping lead the market higher. As Treasury Secretary, Steve Mnuchin reiterated this past week at Davos, “America is open for business!”

For 2018, we continue to overweight select U.S. mega caps, small- and mid-cap value, materials, and commodities.

Note: Market-weighted benchmarks are riskier than they appear and shifts could happen quickly given the prominent role of ETFs in investors’ portfolios today leading to increased market volatility in 2018. Many investors fail to appreciate that indexing to market-weighted benchmarks such as the S&P 500 has created a buy-at-any-price form of momentum investing.

International Markets:

According to the International Monetary Fund (IMF), the Fed’s balance sheet reduction could cause investors to re-balance their portfolios globally and cut flows to emerging economies by as much as $55 billion over the next few years. The resulting outflow will lead to an uptick in emerging market bond yields and could cause concerns about default in countries like China. Therefore, one cannot rule out a period of “risk-off” in global markets in the near-future, and this would boost our dollar and market volatility.

The decline in our dollar helped foreign stocks outperform the S&P 500 in 2018. Continued dollar weakness and the synchronized global recovery continues to favor international and emerging market investments. From a valuation perspective, international markets also look compelling.


Commodities:

Long-Term Dollar Index.png

The dollar should continue to remain weak in 2018 and provide a tailwind for an increase in commodity prices and the earnings of U. S. multinationals. The basic story for commodities in 2018 is that as the synchronized global recovery gains momentum, it should lead to increased demand and concomitant higher prices for basic materials.

Against the backdrop of a weakening dollar and a synchronized global economic recovery, oil helped lead the market recovery post-election after being pounded in 2016 by the Saudi’s effort to drive U.S. producers out of business. Tactically speaking, commodities generally outperform during the latter stages of a market cycle and this time is no different. I initiated exposure to commodities in December 2017 based on my outlook on continued dollar weakness in 2018 and the current market cycle. For now, the dollar could decline further against the Yen and Euro, especially if the Trump administration ignites a trade war as it pursues its fair trade, "America first" agenda. (see dollar index chart above).

Note: The new tax holiday given to U.S. corporations repatriating foreign profits could increase the demand for our dollar and lift the price of it later this year. Also, should the Fed raise rates more aggressively than expected, the greenback’s fortune could reverse, putting pressure on commodity, emerging, and international investments.

Fixed Income:

Fed Dot Plot.png

After declining for three decades, long-term interest rates have stopped trending lower. Valuations of corporate bonds, in particular, appear stretched, while quality has fallen and risks have risen. Investors are not usually rewarded when they dip down to the lower-quality segments of the high-yield and corporate bond market in the late stages of a bull market. The fact is the Fed should have started raising the fed-funds rate several years ago. Now the Fed faces the tough challenge of trying to contain inflation and reduce elevated asset prices—without pushing the economy into a recession.

Given that both the European Central Bank and the Bank of Japan continue to be plagued by low inflation, the consensus view is the Fed will likely tighten three times in 2018 with a median estimate for federal funds rate at 2.1% (see Fed dot plot above).

Fixed income still plays a pivotal role as a stabilizing influence in a diversified portfolio, especially for retirees and pre-retirees. This function is crucial in today's environment, where central banks are retreating from providing quantitative easing and debt levels are elevated. Fixed income investments should be focused on prudent capital preservation at this late stage in the market cycle. Thus, we are keeping our bond allocation defensive and favor a laddered portfolio of high-quality investment grade corporates and municipals. I stated in a February 2016 research piece that, historically, the sweet spot in the yield curve during a rising rate environment has been the five-to-seven-year maturity range. For a closer look at the Cambridge bond strategy, check out our post: Ready your bond portfolio for reflation.

Municipal bond yields should gradually improve -- the backdrop of lower issuance in early 2018 should support muni bond prices in the near-term. The new $10,000 limits for deducting state tax against one’s Federal tax makes municipal bonds even more attractive to wealthy individuals living in high-tax states like California, Connecticut, New York, New Jersey, and Maryland. The two categories that look are appealing within the muni space are the top ten U.S. ports and airports.

Note: On Event Risk. As President Donald Trump faces the Mueller team interview, we cannot rule out the possibility of a constitutional crisis in 2018, which could impact markets. In fact, uncertainties related to current investigations by the Special Counsel may turn out to be a more significant market risk in 2018 than extended valuations, Fed hikes, trade wars, Iran, or North Korea.

The Bottom Line:

The recent corporate tax cut and elimination of over 800 government regulations should help S&P profits expand by 10% in the year ahead and GDP growth could approach 3% in 2018 for the first time in nearly a decade. From a technical standpoint, the U.S. market is showing signs of healthy sector rotation, which is the lifeblood of a bull market. The "break-out" performance turned in by small-caps in Q4 2017 is also a positive sign for investors. However, with the price/earnings ratio for the S&P 500 around 26x, the market is pricey, and investors may want to be cautious in putting new money to work in equities.

Lastly, the elephant in the living room for me remains the actions of Central Banks in 2018. Will our new Fed Chairman, Jerome Powell, prove to be a dove and gently raise interest rates?

After the stellar performance turned in by global markets in 2017, it’s particularly important to revisit your investment portfolio allocation and make sure it’s properly aligned with your risk profile and financial goals. Meeting your goals and return targets without exposure to excessive risk takes thoughtful planning and a disciplined investment strategy.

In our model portfolios, I continue to seek opportunities to make strategic allocation shifts and tactical investments to enhance returns. I will be vigilant in looking for a peak in earnings growth in 2018. Should you have any questions or concerns, please feel free to contact Cambridge Wealth Management.


Sources: Wall Street Journal Online; Bloomberg News; Investor’s Business Daily; Forbes.com; CNBC News; Reuters News; Federal Reserve Bank of St. Louis.

The information contained in this piece is intended for information only and should not be considered investment or tax advice. Please contact your financial adviser with questions about your specific needs and circumstances.Nothing contained herein shall constitute a solicitation, recommendation or endorsement to buy or sell any security. The information and opinions expressed herein are obtained from sources believed to be reliable, however their accuracy and completeness cannot be guaranteed. All data are driven from publicly available information and has not been independently verified by Cambridge Wealth Management, LLC. Opinions expressed are current as of the date of this publication and are subject to change. Certain statements contained within are forward-looking statements including, but not limited to, predictions or indications of future events, trends, plans or objectives. Undue reliance should not be placed on such statements because, by their nature, they are subject to known and unknown risks and uncertainties.

INDEX DESCRIPTIONS:
The past performance of an index is not a guarantee of future results.

The following descriptions, while believed to be accurate, are in some cases abbreviated versions of more detailed or comprehensive definitions available from the sponsors or originators of the respective indices. Anyone interested in such further details is free to consult each such sponsor’s or originator’s website.

Each index reflects an unmanaged universe of securities without any deduction for advisory fees or other expenses that would reduce actual returns, as well as the reinvestment of all income and dividends. An actual investment in the securities included in the index could require an investor to incur transaction costs, which would lower the performance results. Indices are not actively managed and investors cannot invest directly in the indices.

S&P 500®: Standard & Poor’s (S&P) 500® Index. The S&P 500® Index is an unmanaged, capitalization-weighted index designed to measure the performance of the broad US economy through changes in the aggregate market value of 500 stocks representing all major industries.

iShares MSCI Emerging Markets ETF (EEM) seeks to track the investment results of an index composed of large- and mid-capitalization emerging market equities.

Vanguard FTSE Emerging Markets ETF (VWO) invests in stocks of companies located in emerging markets around the world, such as China, Brazil, Taiwan, and South Africa. Goal is to closely track the return of the FTSE Emerging Markets All Cap China A Inclusion Index.

Tax Cuts & Jobs Act Bill Highlights

TCJA Pic.jpg

On December 22, 2017, President Trump signed the Tax Cuts and Jobs Act (TCJA), HR1, into law. The complex nature and last-minute timing of the bill make year-end strategic decisions challenging to evaluate. Depending on your circumstances, you may want to consult with your accountant to ascertain if any tax-minimization strategies should be completed before December 31of this year. Below, we highlight some of the tax bill's major changes:
 

Tax Rates:

Four major changes to the individual tax code go into effect on Monday, January 1 and end on December 31, 2025 due to sunset provisions: Lower tax brackets, an expanded child tax credit, an increased exemption amount for the alternative minimum tax, and a doubled exemption for estate taxes.

The final version of the TCJA cuts the top tax rate to 37%. The proposed rate had been 38.5% rate in the Senate version of the bill or the 39.6% rate in the House version. While many of the bracket thresholds are adjusted, the TCJA preserves the seven tax brackets:

  • 10% retained

  • 15% lowered to 12%

  • 25% lowered to 22%

  • 28% lowered to 24%

  • 33% lowered to 32%

  • 35% retained

  • 39.6% lowered to 37%

New Tax Tables.jpg.gif

Cambridge Insight: To the extent that a standard deduction can be considered a "zero tax bracket," then it should be noted that a "zero tax bracket" under the TCJA can be as large or even larger when considering personal exemptions.


Individual and Family Incentives

  • The standard deduction for tax filers moves from $6,350 for singles, $9,350 for heads of Household, and $12,700 for joint filers to $12,000, $18,000, and $24,000 respectively.

  • The personal exemption (currently $4,050 per eligible exemption) is eliminated.

  • The Affordable Care Act (ACA, also referred to as “Obamacare”) mandate is eliminated, and no penalty can be imposed on individuals who do not wish to enroll in a health insurance plan effective starting in 2019.

  • The TCJA repeals the "kiddie tax" that applies parents' tax rates to the children's unearned income once income reaches a specific threshold. After December 31, 2017, the unearned income of children will be taxed at the trust and estate rates.

  • The tuition waiver benefit is preserved by the final bill. The House Bill would have taxed tuition waivers as ordinary income.

Cambridge Insight: Most taxpayers will have no need to itemize with the doubling of standard deductions, simplifying their tax returns and making it easier to file.

Tax credits

  • The $7,500 credit for the purchase of an electric car is gone, starting in January 2018.

  • The child tax credit is doubled from $1,000 to $2,000 per eligible child. Additionally, the phase-out is increased from $110,000 to $400,000 of adjusted gross income for those who are married filing jointly.

Individual alternative minimum tax (AMT)

AMT is retained but with higher thresholds and phaseouts ensuring the wealthy pay some form of tax. Beginning in 2018, the exemption amounts are increased and the phaseout thresholds rise to $1 million for joint filers and $500,000 for all other taxpayers. These figures are indexed for inflation before the AMT reverts back to the current law in 2026.
 

Federal Estate, Gift, and GST Tax

The TCJA doubles the estate and gift tax exemption for decedents dying between January 1, 2018 and December 31, 2025. The increased, inflation- adjusted exemption amounts for 2018 are doubled to $11.2 million for single filers and $22.4 million for joint filers. After December 31, 2025, the exemption amounts would revert to the prior 5 million amounts plus inflation adjustments.
 

Itemized Deductions:

The TCJA make important changes to itemized deductions:

  • Mortgage interest deductions are eliminated on home equity loans.

  • Mortgage interest on home loans is limited to $750,000 for any home acquisition after December 15, 2017. The provision would expire in 2026.

  • Medical expenses: The AGI threshold for deducting medical expenses is reduced from 10% to 7.5%.

  • Charitable deductions: The AGI limit on cash contributions is increased from 50% to 60% from 2018 through 2025.

  • The state and local tax deduction (SALT): Under the new law, taxpayers are limited to deducting a combined $10,000 in state, real estate, and sales taxes.

Cambridge Insight: Some homeowners will be able to pre-pay some or all of their 2018 real estate taxes if the local tax authority permits and one does not escrow payments with a mortgage. This is a thorny issue so reach out to your accountant or local tax authority for guidance.

Capital Gains:

There are slight changes to income thresholds for the 0%, 15%, and 20% rates beginning in 2018, and they do not match up with the TCJA tax rate brackets. Under previous tax law, the 0% rate was applied to the two lowest tax brackets, the 15% rate to the next four brackets and the 20% rate was applied to the highest tax bracket.

The TCJA retains the 3.8% Affordable Care Act tax on net investment income for certain high income earners with the same income thresholds.

The awful Senate draft bill “back door" capital gains hike on individual investors did not make it into the final bill. Taxpayers will continue to be able to select which shares of securities they sell or gift using the first in, first out (FIFO) rule from a pool of identical securities with different bases.
 

Business Income Tax:

One of the most significant changes under the TJCA is the tax treatment of businesses. U.S. corporate tax rates are now competitive with many other countries, and it’s expected to spur investment in equipment, buildings, and labor. 

  • The TJCA permanently cuts the corporate tax rate from 35% to a flat rate of 21% after December 31, 2017.

  • Pass-through entities are allowed a new deduction for the lesser of 20% for qualified pass-through income or 50% of W-2 wages paid with respect to the business income to bring the rate lower. The deduction is not affected whether the owner is active or passive. However, it can get tricky since the deduction is subject to new restrictions and limits.

  • Certain service businesses are prohibited from benefiting from the lower rate. Disqualified service businesses are defined as: law, health, investment management, partnership interests, engineers, and architects to name a few.

    For a closer look at how the new rules will affect various pass-through entities, check out this piece by Forbes contributor, Kelly Phillips Erb.


The Bottom Line

Going forward in 2018, there are considerable areas of ambiguity in the TCJA that will create planning challenges for many tax filers (and additional revenue for large accounting and tax law firms). As with any sweeping legislation changes, possible amendments to rectify unintended consequences of the new law will evolve as practitioners become familiar with the TCJA.

You should strongly consider what year-end planning opportunities may be possible. Here are a few to contemplate:

  • Consider potential changes in income and personal circumstances in light of potential tax law changes.

  • Consider bunching itemized deductions.

  • Accelerate or prepay deductions in 2017. Why? Higher tax rates this year = more valuable deductions plus potential complete loss of certain tax deductions in 2018.

  • Prepay your 2018 property taxes (the new threshold is $10,000) if the local tax authority permits and you do not escrow payments with a mortgage.

  • Pay down your home equity line or refinance your home mortgage.

  • Consider AMT: Defer or accelerate income and bonuses to the extent possible.

If you would like to read the conference report here (downloads as a large pdf - 1097 pages).

Sources: The Tax Cut and Jobs Act of 2017, H.R.1, 115th Congress; Wall Street Journal Online; Bloomberg News; Forbes.com; CNBC News; The Heritage Foundation.org; Reuters News.

The information contained in this piece is intended for information only and should not be considered investment or tax advice. Please contact your financial adviser with questions about your specific needs and circumstances.

The information and opinions expressed herein are obtained from sources believed to be reliable, however their accuracy and completeness cannot be guaranteed. All data are driven from publicly available information and has not been independently verified by Cambridge Wealth Management, LLC. Opinions expressed are current as of the date of this publication and are subject to change. Certain statements contained within are forward-looking statements including, but not limited to, predictions or indications of future events, trends, plans or objectives. Undue reliance should not be placed on such statements because, by their nature, they are subject to known and unknown risks and uncertainties.


The Tax Cut Plan: What’s in it for you?

Tax Reform_2017.jpg

In Brief:

  • The proposed Tax Cut and Jobs Act (TCJA), which is making its way through Congress, would be the first major tax reform in over 30 years.

  • Under TCJA, corporate tax rates would move from 35% to 20%.

  • Trump’s tax plan called for collapsing seven tax brackets to three. The proposed plan in the House has four tax brackets, and the Senate’s plan still has seven brackets.

  • Standard deductions are doubled in the both plans, and itemized deductions are eliminated except for charitable and home mortgage interest on loans up to $500,000.

  • The Affordable Care Act (ACA, also referred to as “Obamacare”) mandate would be eliminated, and no penalty would be imposed on individuals who do not wish to enroll in a health insurance plan.

The sweeping tax code rewrite that President Trump promised during his campaign has finally passed the Senate, and it’s headed for final reconciliation with the House version of the plan. As expected, Republican fiscal conservatives, except for Senator Corker, set aside their principles and gave Trump what he wanted: “massive tax reduction.” While the reduction in the business tax rate is substantial, marginal rates should have been reduced significantly in the Senate version of the plan.

Here is a list of some key provisions of the tax cut plan (TCJA) that, if enacted, will have the greatest impact on individual taxpayers:


Brackets & Rates For Married-Joint Filers:

11-15-17-married-jointly-tax-brackets-current-house-senate.png

Note: the Senate version of the plan does not reduce the number of tax brackets - a goal of the Congressional plan and President Trump.


Brackets for single files are one-half married taxpayers:

11-15-17-single-tax-brackets-current-house-senate.png

The standard deduction for joint filers moves to $24,000 for married taxpayers and $12,000 for individuals; the personal exemptions will be eliminated.


Capital Gains:

No change: 0,15, and 20% rates

The TCJA retains the 3.8% Affordable Care Act tax on net investment income.

The Senate bill “back door" capital gains hike on individual investors is awful and it should be eliminated. Mutual funds got a carve out and are exempt from first in, first out (FIFO) while individuals will be forced to sell their most highly appreciated assets using FIFO.

Alternative minimum tax (AMT) remains partially in place ensuring the wealthy pay some form of tax.
 

Deductions:

Itemized deductions are eliminated other than charitable and mortgage interest. Most taxpayers will have no need to itemize with the doubling of standard deductions, simplifying their tax returns and making it easier to file.

  • There is an increase in the child tax credit. TCJA increases credit to $1,600 but only $1,000 is refundable. TCJA increases income levels at which Child Tax Credit phases out. Credits are complex and do not help simplify tax return filing.

  • Property tax deductions are capped at $10,000 annually under both bills.

  • Mortgage interest deductions are eliminated on home equity loans. Mortgage interest on home loans is eliminated at $500,000. According to the Home Depot CEO in a recent CNBC interview: “Only 5% of Americans have a mortgage greater than $500,000.”

  • The state and local tax deduction (SALT) is eliminated completely in both proposals. This is a very thorny issue and still under intense discussion.

Business Income Tax:

As we stated in our January piece entitled, “Trump’s Tax Plan: The Simplified Facts": “Fundamental tax reform is needed to promote economic growth, job creation, and international competitiveness. Our corporate tax rate is 10 points higher than the global average."

U.S. corporate tax rates are now competitive with many other countries, and it’s expected to spur investment in equipment, buildings, and labor. The TJCA cuts the corporate tax rate from 35% to 20%. The corporate alternative minimum tax remains in place although Representative McCarthy of California is calling for a uniform corporate AMT. Technology companies, which benefit from research and development deductions, are hurt the most, hence the recent sell-off in the tech sector.

  • Supporters of the Senate plan point out that corporate income is generally taxed twice — once at the company level and a second time when earnings are paid out to shareholders — so the proposal is fair.

  • The TCJA will provide a deemed repatriation of corporate profits held offshore at a one-time tax rate of 10%.

  • Enhanced expensing for manufacturers and Real Estate Investment Trusts: No surprise here — the new tax law favors Trump and his son-in-law’s business entities. In fact, commercial real estate may be the biggest winner under the proposed plan.

Our tax code will no longer penalize small business owners in America — the backbone of our economy and the real job creators.

  • Pass-throughs in the House plan move from a top tax rate of 39.6% to 25%, while prohibiting anyone providing professional services (e.g., lawyers and accountants) from benefiting from the lower rate.

  • The Senate plan allows for a 23% tax deduction. Under the Senate plan, the deduction begins to phase out for anyone in a service business except those with taxable incomes under $500,000. Above $600,000, there's no deduction at all.

Year-end tax planning:

It’s easy to feel overwhelmed when it comes to the subject of tax planning. While we don’t yet have a clear understanding of the details of the final bill, it's very likely that some combination of the above highlights from the TCJA Plan will become part of our tax law by Christmastime. Therefore, some traditional tax planning strategies may still apply. Here are a few to contemplate:

  • Consider changes in income and personal circumstances in light of potential tax law changes.

  • Accelerate or prepay deductions in 2017. Why? Higher tax rates this year = more valuable deductions plus potential complete loss of certain tax deductions in 2018.

  • Prepay your 4th quarter 2017 state income taxes and 2018 property taxes (the new threshold is $10,000).

  • Pay down your home equity line or refinance your home mortgage.

  • Harvest tax losses to offset capital gains. Pay attention to the "wash sale" rule and wait 31 days to buy back the same security.

  • Consider gifting a portion of your required minimum distribution (RMD) from your IRA direct to a charitable institution by December 31. Note: Charitable gifts to hurricane relief are deductible even for those who do not itemize.

  • Delay retirement plan distributions and Roth IRA conversions.

  • Consider AMT: Defer or accelerate income and bonuses.

The end goal of tax reform is to make our tax system as fair as possible for everyone and promote growth. While these bills are far from perfect, especially for individual taxpayers, the business tax cuts are expected to spur investment in equipment, buildings, and labor. And that's good for all of us.

We will keep you informed of material changes to our tax laws that may go into effect by Christmas.


Sources: The Wall Street Journal Online; Bloomberg News; Forbes.com; CNBC News; Business Insider; Reuters News.


The information contained in this piece is intended for information only and should not be considered investment advice. Please contact your financial adviser with questions about your specific needs and circumstances.

The information and opinions expressed herein are obtained from sources believed to be reliable, however their accuracy and completeness cannot be guaranteed. All data are driven from publicly available information and has not been independently verified by Cambridge Wealth Management, LLC. Opinions expressed are current as of the date of this publication and are subject to change. Certain statements contained within are forward-looking statements including, but not limited to, predictions or indications of future events, trends, plans or objectives. Undue reliance should not be placed on such statements because, by their nature, they are subject to known and unknown risks and uncertainties.

The Equifax Data Hack: To lock or Freeze your File?

Credit hack.jpg

Updated September 20, 2018

The recent revelation of a massive data breach at Equifax potentially affecting 143 million consumers brought back memories of my own 2001credit fraud experience in Boston; it was an unnerving and horrific experience. Upon hearing the news of this most recent breach, I immediately checked out the link at Equifax.com and learned that, unfortunately, my credit file was among those compromised.

In light of the shocking news of the Equifax data hack and having been a victim of ID theft in the past, I thought I would share some “do’s and don'ts" to help calm your concerns and provide clarity on the differences between a credit freeze, credit lock, and fraud alert.


Do this first: Go to the official link being provided by Equifax

www.equifaxsecurity2017.com.

Type this address into your browser yourself. Click on:
1. "Read" button, 
2. "Enroll" button, and,
3. "Begin Enrollment" button.

You will be prompted to type in your last name and the last six digits of your Social Security Number (SSN). The next screen will inform you if your personal information has been compromised. Even if Equifax says your file wasn't compromised, assume it was and take the necessary steps to protect yourself.

Equifax is offering free identity theft protection and credit file monitoring to all U.S. consumers for one year only. The offering is called "TrustedID Premier" and includes a lock (not freeze) on your credit file.


Credit Freeze, Credit Lock or Fraud Alert?

Equifax has revised its botched response to their data breach since last week and is now waiving the typical "freeze" fee if you act before November 21. Even if you miss the deadline, many states allow you to add or lift a freeze, (not “lock") for free as long as you're a victim of ID theft. Given Equifax’s numerous missteps since announcing the breach on September 7, waiving fees to freeze your credit file is the least management can do.

While a credit freeze and credit lock have similarities, the difference between the two is highlighted below:

  • Credit freeze: Locks your credit file to creditors and should prevent bad people from taking out loans and opening credit card accounts in your name. A security freeze remains on your credit file until you remove it. While a freeze may be the best option to guard against fraud, it may involve fees to add or lift it from your account — the cost of which varies by state but generally costs between $5 - $10. credit-freeze-information-by-state. (*see footnote: New legislation allows consumers to lift or add a freeze without charge as of May 24, 2018).

    If you're applying for credit, you will also need to plan in advance and notify a credit bureau to lift your freeze. It takes about 3 days for your freeze to thaw. Equifax and Experian have a link in their footers to add a security freeze under the heading “Support.” Type this link in you browser to add a security freeze to your TransUnion credit file: https://www.transunion.com/credit-freeze.

  • Credit lock: Locking your account prevents unauthorized credit activity and puts you in control with no waiting, no PIN to remember, and no additional paperwork. You can unlock your credit report at any time with ease. TransUnion makes it easy to find their credit report lock on their home page under a big, blue button. Type this link into your browser to compare Experian's offerings: https://www.experian.com/consumer-products/compare-to-lifelock.html

  • Fraud alert: When placed on your credit file, an alert merely cautions creditors that your information may have been stolen. But many creditors don't even check this; it’s also temporary.

The breach at Equifax has led many experts to recommend that consumers lock their credit reports. The three credit bureaus may also encourage you to "lock" instead of “freeze” your credit file. Why? Because it's easier and credit freezes are regulated by law while locks aren't; no waiver terms or binding arbitration can be imposed on consumers who request a credit report freeze. Plus, if your credit file is frozen, the bureaus can’t sell your information to creditors and other companies for marketing purposes.

Do keep this in mind: The breach at Equifax is severe, and criminals will be able to use the information they've obtained five years from now and beyond — one year of protection being offered through Equifax's Trusted ID Premier is a start, but it isn't enough. Also, Equifax does not notify other national consumer credit reporting agencies of your request to lock or freeze your credit report. You will need to contact them separately to add a lock or freeze to your file.
 

Now for Some Don'ts

  • Don’t click online ads or links you see in news stories related to the Equifax hack; always re-type a link into your browser. There are links being circulated by data theft rings. Beware of phishing and malicious links. Urgent-sounding, legitimate-looking emails are intended to tempt you to accidentally disclose personal information or install malware. Don’t open links or attachments from unknown sources. Enter the web address in your browser. The only links you should click on are on the Equifax.com, TransUnion.com, or Experian.com websites.

  • Don’t provide information to companies that send you emails or call you on the phone. Fraudsters move quickly and never miss an opportunity to take advantage of a crisis like the historic Equifax data breach. They may try to fool you because they will know your Social Security number and other personal information. Remember, your bank, personal financial advisor, and credit card companies do not need to contact you to confirm personal information or ask you for money – they already have it.

  • Don't worry about changing your investment, checking, or savings account numbers. These numbers are not in your credit files. It's also not necessary to cancel your credit card accounts. However, you still need to regularly monitor your bank and credit card accounts just in case thieves use your stolen information to impersonate you and gain access to your accounts.

  • Don’t leave bill payment envelopes in your mailbox with the flag up for pick up. Promptly remove incoming mail to guard against theft. And, do not drop off bill payment envelopes in the big blue USPS mailboxes after pickup hours - fraudsters can monitor your patterns and “fish out” your mail with rodent glue traps.

  • Don't believe that if you freeze or lock your account, you can now relax. The overwhelming majority of fraud involves existing accounts, not new ones.

More on best practices

Cybercrime and fraud are constant threats in today’s digital, age and vigilance is key. Since being a victim of credit fraud in 2001, I regularly monitor my personal and business credit card accounts, bank accounts, and credit report. I've set up alerts on my checking and credit card accounts, so anytime there's activity over a certain dollar amount, I'm notified.

I encourage you to follow the best practices highlighted in this post and apply caution when sharing information or executing transactions. It will make a big difference in protecting your financial information and give you peace of mind.

Visit these sites for more information and best practices:

For a free copy of your annual credit report, only go to:

www.annualcreditreport.com

Call: 877-322-8228

Send a request via certified mail: Annual Credit Report Request Service, P.O. Box 105281, Atlanta, Georgia 30348-5281.

Equifax dedicated call center: 866-447-7559, every day (including weekends) from 7:00 a.m. – 1:00 a.m. Eastern Time.


Footnote:

*On May 24, 2018, President Trump signed the Economic Growth, Regulatory Relief and Consumer Protection Act. The new legislation will allow consumers to “freeze” their credit files at the three major credit reporting bureaus — Equifax, Experian and TransUnion — without charge. Consumers can also lift a security freeze temporarily or permanently, without a fee.


Disclosure:

The information contained in this piece is intended for information only, and should not be considered financial planning advice. The information and opinions expressed herein are obtained from sources believed to be reliable, however their accuracy and completeness cannot be guaranteed. All data are driven from publicly available information and has not been independently verified by Cambridge Wealth Management, LLC. Opinions expressed are current as of the date of this publication and are subject to change. Certain statements contained within are forward-looking statements including, but not limited to, predictions or indications of future events, trends, plans or objectives. Undue reliance should not be placed on such statements because, by their nature, they are subject to known and unknown risks and uncertainties.

Will Your Money Last? Risks to Retirement Income

Retirement Savings.jpg

In brief:

  • A sound retirement income plan takes into account several financial risks including the potential for the retiree to outlive his or her assets and the effects of inflation on future income.

  • Other considerations include rising living and healthcare costs, as well as taking excess withdrawals from your retirement account and uncertainty about the future of Social Security benefits.

  • The overall objective of planning should be to create a sustainable stream of income that also has the potential to increase over time.


With so much at stake when planning a retirement income stream, it pays to take a step back and see whether your plan takes into account the major obstacles to retirement income adequacy. When you take this big-picture view, there are two major challenges that most retirees face:

  • Longevity risk: the possibility that you will outlive your savings. We’re living longer, healthier lives.

  • Investment risk: the possibility that an actual return on investment will be lower than your expected return.

There are other important considerations that can impact your long-term financial security too, including factors like rising living and healthcare costs, as well as uncertainty about the future of Social Security benefits. Understanding and addressing each of these challenges can lead to more confident retirement preparation.


Longevity risk

While most people look forward to living a long life, they also want to make sure their longevity is supported by a comfortable financial cushion. As the average life span has steadily lengthened due to advances in medicine and sanitation, the chance of prematurely depleting one's retirement assets has become a matter of great concern.

Consider a few numbers: According to the latest government data, average life expectancy in the United States climbed to 77.9 years for a child born in 2007, compared to 47.3 years in 1900. But most people don't live an average number of years. In reality, there's a 50 percent chance that at least one spouse of a healthy couple aged 65 will reach age 89 (see table below).1
 

Perspectives on Longevity
 

Chance of Living to a Specific Age

50%         25%

Male aged 65:                        age 83      age 88

Female aged 65:                     age 86      age 90

50% chance at least one of a 65-year-old couple will reach age 89.
Source: Social Security Administration, Period Life Table, 2007.

>> Related: Use the Social Security Administration's life expectancy calculator to estimate your longevity.


Investment Risk

The decision about how much money may be safely withdrawn each year from a retirement nest egg needs to take into consideration all the risks mentioned above. But retirees also must consider the fluctuating returns that their personal savings and investments are likely to produce over time, as well as the overall health of the financial markets and the economy during their withdrawal period.

The stock market's collapse in 2008, after a short bull market run following the Tech Bubble, illustrates the dangers of withdrawing too much too soon. Investors have short memories and often forget that the market was down 50% from it's high in March 2009. Withdrawing 7 percent or even more per year from a retirement portfolio during the bull market years might have seemed a reasonable rate. But the ensuing bear market in stocks raised the possibility that the value of a retiree's portfolio might be reduced as a result of stock market losses, increasing the chance that the retiree would outlive his assets.

According to one analysis, the average maximum sustainable withdrawal rate over any 30-year period for a balanced portfolio of stocks and bonds was 6.3 percent after adjusting for inflation. One strategy that may potentially avoid premature exhaustion of assets is to adopt a relatively conservative withdrawal rate of 4 percent a year. The same study showed that a withdrawal rate of 4 percent was sustainable in 95 percent of the periods studied.2
 

Inflation and cost of living

The increase in the price of certain items varies over time as well as from region to region and according to personal lifestyle. Through many ups and downs, U.S. consumer annual inflation has averaged about 3 percent since 1926. If inflation were to continue increasing at a 3 percent annual rate, a dollar would be worth only 54 cents in just 20 years. Conversely, the price of an automobile that costs $23,000 today would rise to more than $41,000 within two decades.

For retirees who no longer fund their living expenses out of wages, inflation affects retirement planning in two ways:

  • It increases the future cost of goods and services, and

  • it potentially erodes the value of assets set aside to meet those costs -- if those assets earn less than the rate of inflation.
     

Healthcare costs

The cost of medical care has emerged as a more important element of retirement planning in recent years. That's primarily due to three reasons:

  • Healthcare expenses have increased at a faster pace than the overall inflation rate.

  • Many employers have reduced or eliminated medical coverage for retired employees.

  • Life expectancy has lengthened.

In addition, the nation's aging population has placed a heavier burden on Medicare, the federal medical insurance program for those aged 65 and older, in turn forcing Medicare recipients to contribute more toward their benefits and to purchase supplemental insurance policies.

The Employee Benefit Research Institute has estimated that if recent trends continue, a typical retiree who is age 65 now and lives to age 90 will need to allocate about $180,000 of his or her nest egg just for medical costs, including premiums for Medicare and "Medigap" insurance to supplement Medicare. Because of the higher cost trends affecting private health insurance, the same retiree relying on insurance coverage from a former employer may need to allot nearly $300,000 to pay health insurance and Medicare premiums, as well as out-of pocket medical bills.
>> Related: CWM White paperRetiree Healthcare: What Will It Cost You?


Future of Social Security

50Gray2_081717.png

The demographic forces that have led to an increasingly older population are expected to continue, putting more pressure on the financial resources of the Social Security system -- the government safety net that currently provides more than half of the income for six out of 10 Americans aged 65 or older. This isn’t a pressing issue at the current time, but with ongoing discussions about how to revamp Social Security to keep it solvent for longer, it is wise to consider Social Security maximization strategies in your retirement planning.
 

Addressing these risks

While the risks discussed above are common to most people, their impact on retirement income varies from person to person. Before you can develop a realistic plan aimed at providing a sustainable stream of income for your retirement, you will have to relate each risk to your unique situation. For example, if you are in good health and intend to retire in your mid-60s, you may want to plan for a retirement lasting 30 years or longer. And when you estimate the effects of inflation, you may decide that after you retire you should continue to invest a portion of your assets in investments with the potential to outpace inflation.

Developing a realistic plan to address the financial risks you face in retirement may seem beyond you. But you don't have to go it alone. At Cambridge Wealth Management, we offer an array of financial planning and investment services. So no matter where you are in life – whatever complexities you may face – Cambridge Wealth is equipped to help you guide you along the best path toward achieving your retirement life goals.


Source/Disclaimer:
1. Source: Social Security Administration, Period Life Table, 2007 (latest available).
2. Source: DST Systems, Inc. This example is a compilation of all 30-calendar-year holding periods from 1926 to 2015, based on a portfolio of 60% U.S. stocks and 40% long-term U.S. government bonds, with annual withdrawals adjusted for actual historical changes in the Consumer Price Index. The example is not intended as investment advice. Actual sustainable withdrawal rates ranged from 3.7% to 11.4% in the periods studied. Please consult a financial advisor if you have questions about choosing a withdrawal rate and how it relates to your own financial situation.

Because of the possibility of human or mechanical error by Wealth Management Systems Inc. or its sources, neither Wealth Management Systems Inc. nor its sources guarantees the accuracy, adequacy, completeness or availability of any information and is not responsible for any errors or omissions or for the results obtained from the use of such information. In no event shall Wealth Management Systems Inc. be liable for any indirect, special or consequential damages in connection with subscriber's or others' use of the content.

Investors should carefully consider their own investment objectives and never rely on any single chart, graph or marketing piece to make decisions. The information contained in this piece is intended for information only, is not a recommendation and should not be considered investment advice. Please contact your financial adviser with questions about your specific needs and circumstances. Cambridge Wealth Management reorganized parts of the introduction, middle, and closing paragraphs, added the clickable links, and the chart titled "Retirement costs soar for Uncle Sam." All data are driven from publicly available information and has not been independently verified by Cambridge Wealth Management, LLC. Certain statements contained within are forward-looking statements including, but not limited to, predictions or indications of future events, trends, plans or objectives. Undue reliance should not be placed on such statements because, by their nature, they are subject to known and unknown risks and uncertainties.

Happy 4th of July!

U.S. financial markets and Cambridge Wealth Management will be open on Monday, July 3rd until 1pm. On Tuesday, July 4th, our office and U.S. financial markets will be closed in observance of Independence Day.

Normal business hours will resume on Wednesday, July 5th.

Cambridge Wealth Management wishes you and your family a safe and Happy 4th of July!


Tax Strategies for Retirees

mature couple canoeing.jpg

In Brief:

Managing taxes in retirement can be complex. Thoughtful planning may help reduce the tax burden for you and your heirs.

  • Consider the tax implications of different investments—such as municipal bonds and index funds—and maintain a portfolio that fully utilizes the range of tax-efficient strategies available.

  • Rethink how you allocate investments to—and make withdrawals from—taxable and tax-deferred accounts. Tax-deferred investments have greater earning potential than their taxable counterparts due to compounding, yet withdrawals from tax-deferred accounts are subject to higher taxes than investments held for a year or more in taxable accounts.

  • You will need to work out a comprehensive estate and gifting plan with competent professionals so you can make the most of your money while you are alive and maximize what you pass on to heirs.

Nothing in life is certain except death and taxes.
— Benjamin Franklin

That saying still rings true roughly 300 years after the former statesman coined it. Yet, by formulating a tax-efficient investment and distribution strategy, retirees may keep more of their hard-earned assets for themselves and their heirs. Here are a few suggestions for effective money management during your later years.
 

Less Taxing Investments

Municipal bonds, or "munis" have long been appreciated by retirees seeking a haven from taxes and stock market volatility. In general, the interest paid on municipal bonds is exempt from federal taxes and sometimes state and local taxes as well (see table).1 The higher your tax bracket, the more you may benefit from investing in munis.

Also, consider investing in tax-managed mutual funds. Managers of these funds pursue tax efficiency by employing a number of strategies. For instance, they might limit the number of times they trade investments within a fund or sell securities at a loss to offset portfolio gains. Equity index funds may also be more tax-efficient than actively managed stock funds due to a potentially lower investment turnover rate.

It's also important to review which types of securities are held in taxable versus tax-deferred accounts. Why? Because the maximum federal tax rate on some dividend-producing investments and long-term capital gains is 20%.* In light of this, many financial experts recommend keeping real estate investment trusts (REITs), high-yield bonds, and high-turnover stock mutual funds in tax-deferred accounts. Low-turnover stock funds, municipal bonds, and growth or value stocks may be more appropriate for taxable accounts.
 

The Tax-exempt advantage: when less may yield more


Would a tax-free bond be a better investment for you than a taxable bond? Compare the yields to see. For instance, if you were in the 25% federal tax bracket, a taxable bond would need to earn a yield of 6.67% to equal a 5% tax-exempt municipal bond yield.
Federal Tax Rate 15% 25% 28% 33% 35% 39.6%
Tax-Exempt Rate Taxable-Equivalent Yield
4% 4.71% 5.33% 5.56% 5.97% 6.15% 6.62%
5% 5.88% 6.67% 6.94% 7.46% 7.69% 8.28%
6% 7.06% 8% 8.33% 8.96% 9.23% 9.93%
7% 8.24% 9.33% 9.72% 10.45% 10.77% 11.59%
8% 9.41% 10.67% 11.11% 11.94% 12.31% 13.25%
The yields shown above are for illustrative purposes only and are not intended to reflect the actual yields of any investment.


Which Securities to Tap First?

Another major decision facing retirees is when to liquidate various types of assets. The advantage of holding on to tax-deferred investments is that they compound on a before-tax basis and therefore have greater earning potential than their taxable counterparts.

On the other hand, you'll need to consider that qualified withdrawals from tax-deferred investments are taxed at ordinary federal income tax rates of up to 39.6%, while distributions—in the form of capital gains or dividends—from investments in taxable accounts are taxed at a maximum 20%.* (Capital gains on investments held for less than a year are taxed at regular income tax rates.)
 

The Ins and Outs of RMDs

The IRS mandates that you begin taking an annual RMD from traditional IRAs and employer-sponsored retirement plans after you reach age 70½. The premise behind the RMD rule is simple—the longer you are expected to live, the less the IRS requires you to withdraw (and pay taxes on) each year.

RMDs are now based on a uniform table, which takes into consideration the participant's and beneficiary's lifetimes, based on the participant's age. Failure to take the RMD can result in a tax penalty equal to 50% of the required amount. TIP: If you'll be pushed into a higher tax bracket at age 70½ due to the RMD rule, it may pay to begin taking withdrawals during your sixties.
 

Estate Planning and Gifting

There are various ways to make the tax payments on your assets easier for heirs to handle. Careful selection of beneficiaries of your money accounts is one example. If you do not name a beneficiary, your assets could end up in probate, and your beneficiaries could be taking distributions faster than they expected. In most cases, spousal beneficiaries are ideal, because they have several options that aren't available to other beneficiaries, including the marital deduction for the federal estate tax.

Also, consider transferring assets into an irrevocable trust if you're close to the threshold for owing estate taxes. In 2017, the federal estate tax applies to all estate assets over $5.49 million. Assets in an irrevocable trust are passed on free of estate taxes, saving heirs thousands of dollars. TIP: If you plan on moving assets from tax-deferred accounts, do so before you reach age 70½, when RMDs must begin.

Finally, if you have a taxable estate, you can give up to $14,000 per individual ($28,000 per married couple) each year to anyone tax free. Also, consider making gifts to children over age 14, as dividends may be taxed—or gains tapped—at much lower tax rates than those that apply to adults. TIP: Some people choose to transfer appreciated securities to custodial accounts (UTMAs and UGMAs) to help save for a grandchild's higher education expenses

Strategies for making the most of your money and reducing taxes are complex. Your best recourse? Plan ahead and consider meeting with a competent tax advisor, an estate attorney, and a financial professional to help you sort through your options.

Source/Disclaimer:

1. Capital gains from municipal bonds are taxable and interest income may be subject to the alternative minimum tax.
2. Withdrawals prior to age 591/2 are generally subject to a 10% additional tax.
* Income from investment assets may be subject to an additional 3.8% Medicare tax, applicable to single-filer taxpayers with a modified adjusted gross income of over $200,000 and $250,000 for joint filers.

Because of the possibility of human or mechanical error by Wealth Management Systems Inc. or its sources, neither Wealth Management Systems Inc. nor its sources guarantees the accuracy, adequacy, completeness or availability of any information and is not responsible for any errors or omissions or for the results obtained from the use of such information. In no event shall Wealth Management Systems Inc. be liable for any indirect, special or consequential damages in connection with subscriber's or others' use of the content. Cambridge Wealth Management updated the federal estate tax exemption. © 2016 DST Systems, Inc. Reproduction in whole or in part prohibited, except by permission. All rights reserved. Not responsible for any errors or omissions.

Investors should carefully consider their own investment objectives and never rely on any single chart, graph or marketing piece to make decisions. The information contained in this piece is intended for information only, is not a recommendation and should not be considered investment advice. Please contact your financial adviser with questions about your specific needs and circumstances. All data are driven from publicly available information and has not been independently verified by Cambridge Wealth Management, LLC. Certain statements contained within are forward-looking statements including, but not limited to, predictions or indications of future events, trends, plans or objectives. Undue reliance should not be placed on such statements because, by their nature, they are subject to known and unknown risks and uncertainties.

Should you convert to a Roth IRA?

In Brief:

Investors at any level of income can convert assets from a traditional IRA to a Roth IRA. This article explains the potential benefits and tax implications of a conversion.

There are several key differences between a traditional IRA and a Roth IRA that can impact your wallet. So, are there benefits to converting all or a portion of your traditional IRA assets into a Roth? The answer to this query likely depends on:

  • The amount of time you plan to leave the assets invested,
  • Your estate planning strategies, and
  • Your willingness to pay the federal income tax bill that a conversion is likely to trigger.
     

Two Types of IRAs

Each type of IRA has its own specific rules and potential benefits. These differences are summarized in the table below.

Traditionalvs. Roth  IRA.jpg

Conversion: Potential Benefits ...

Potential benefits of converting from a traditional IRA to a Roth IRA include:

  • A larger sum to bequeath to heirs. Since lifetime RMDs are not required for Roth IRAs, investors who do not need to take withdrawals may leave the money invested as long as they choose which may result in a larger balance for heirs.
     
  • Additional planning consideration – estate taxes: State estate taxes do not provide an IRD deduction (income in respect of decedent). Therefore, estate tax savings must be balanced against future income tax rates for you and your heirs. In short, estate tax benefits are greater at the state level, and only relevant at the Federal level for IRA-centric estates. Note: After an account owner's death, beneficiaries must take required minimum distributions, although different rules apply to spouses and non spouses.
     
  • Tax-free withdrawals. Even if retirees need withdrawals for living expenses, withdrawals are tax free for those who are age 59½ or older and who have had the money invested for five years or more.
     

... As Well as a Potential Drawback

  • Taxes upon conversion. Investors who convert proceeds from a traditional IRA to a Roth IRA are required to pay income taxes at the time of conversion on investment earnings and any contributions that qualified for a tax deduction. If you have a nondeductible traditional IRA (i.e., your contributions did not qualify for a tax deduction because your income was not within the parameters established by the IRS), investment earnings will be taxed but the amount of your contributions will not.
     
  • The conversion will not trigger the 10% additional tax for early withdrawals.
     

Which Is Right for You?

If you have a traditional IRA and are considering converting to a Roth IRA, here are a few factors to consider:

  • A conversion may be more attractive the further you are from retirement. The longer your earnings can remain invested, the more time you have to help compensate for the associated tax bill. Pay the tax when your tax rate is anticipated to be the lowest.
     
  • Tax equivalency principle: Your current and future tax brackets will affect which IRA is best for you. If you expect to be in a lower tax bracket during retirement, sticking with a traditional IRA could be the best option because your RMDs during retirement will be taxed at a correspondingly lower rate than amounts converted today. On the other hand, if you anticipate being in a higher tax bracket, the ability to take tax-free distributions from a Roth IRA could be an attractive benefit.

There is no easy answer to the question "Should I convert my traditional IRA assets to a Roth IRA?" As with any major financial decision, careful consultation with your financial advisor and accountant is a good idea before you make your choice.


Source/Disclaimer:

1. IRA account holders (both traditional and Roth) may avoid the 10% additional federal tax on withdrawals before age 59½ only if they meet specific criteria established by the IRS. See Publication 590-A for more information.

Because of the possibility of human or mechanical error by Wealth Management Systems Inc. or its sources, neither Wealth Management Systems Inc. nor its sources guarantees the accuracy, adequacy, completeness or availability of any information and is not responsible for any errors or omissions or for the results obtained from the use of such information. In no event shall Wealth Management Systems Inc. be liable for any indirect, special or consequential damages in connection with subscriber's or others' use of the content. Cambridge Wealth Management rewrote parts of the introduction, closing paragraph, and added the section titled "Additional planning consideration – estate taxes," and the term "tax equivalency principle." © 2016 DST Systems, Inc. Reproduction in whole or in part prohibited, except by permission. All rights reserved. Not responsible for any errors or omissions.

Investors should carefully consider their own investment objectives and never rely on any single chart, graph or marketing piece to make decisions. The information contained in this piece is intended for information only, is not a recommendation and should not be considered investment advice. Please contact your financial adviser with questions about your specific needs and circumstances. All data are driven from publicly available information and has not been independently verified by Cambridge Wealth Management, LLC. Certain statements contained within are forward-looking statements including, but not limited to, predictions or indications of future events, trends, plans or objectives. Undue reliance should not be placed on such statements because, by their nature, they are subject to known and unknown risks and uncertainties.

Ready Your Bond Portfolio For Reflation

photodune-7203994-business-documents-m.jpg

In Brief:

  • Donald J. Trump’s surprise election victory is a sea change, opening the way for substantial tax and regulatory reforms that should lead to reflation: improving growth, wage gains, and concomitant inflation.

  • Post-election, the shorter end of the yield curve immediately steepened, suggesting bond investors see more growth in the near term. However, the long end of the yield curve has flattened, signaling that fiscal stimulus now may become a fiscal drag over the long term.
     
  • We expect to see a modest rise in the 10-year Treasury from the current level of about 2.4 percent (watch 2.60 percent level).
     

The Yield curve "Tell"

First, let’s begin by defining a yield curve. A yield curve is a line that plots the interest rates, at a point in time, of bonds having equal credit quality but differing maturity dates. The most commonly reported yield curve compares the three-month, two-year, five-year, 10-year, and 30-year U.S. Treasury debt. [1}

Read more: Yield Curve Definition | Investopedia

The yield curve reflects the collective wisdom of millions of bond investors, and historically, it has been a strong predictor of economic booms and busts. The steepness or flatness of the yield curve is an indication of economic growth. The steeper the curve, the more investors expect inflation and interest rates to rise in the future. Conversely, when the yield curve flattens (or inverts -- shorter-term rates are higher than long-term rates), then investors expect a slowing economy. Also, our Federal Reserve Bank’s buying programs exert influence on the shape of our yield curve.

With the post-election spike in the 10-year Treasury, the bond market is telling us that Trump’s proposed policies are reflationary (see chart below). Over the short run, the bond market is signaling that moderately improving economic growth will lead to gradually rising interest rates. However, the long end of the yield curve has flattened, which means that Trump’s fiscal stimulus plans of lower tax rates and trillion-dollar infrastructure spending could become an economic drag later. And if Trump’s policies add to our $20 trillion in national debt, future costs of servicing our national debt due to higher interest rates could present a real drag on GDP.


The congressional budget office numbers

Each year in February, we review the CBO Budget and Economic Outlook report. According to this year’s report:
“As the slack in the economy continues to diminish, the Federal Reserve will continue to reduce its support of economic growth, in CBO’s view. Thus, the federal funds rate — the interest rate that financial institutions charge one another for overnight loans of their monetary reserves — is expected to rise gradually over the next few years, reaching 1.1 percent in the fourth quarter of 2017 and 1.6 percent in the fourth quarter of 2018, and 3.1 percent in the later part of the projection period. [2]
 

Our bond portfolio base case

  • We advocate holding Treasury Inflation-Protected Securities (TIPS) in bond portfolios.
  • We favor shortening interest rate exposure. (Floating rate bonds look pricey).
  • We prefer financial paper, selective U.S. fixed rate bank preferreds, and investment-grade corporate bonds over Treasuries.
  • President Trump's proposed tax reforms could reduce the attractiveness of municipal bonds and presents risks for investors.
  • We recommend a simple laddered bond strategy.

Historically, the sweet spot in the yield curve during a rising rate environment has been the five-to-seven-year maturity range. While we expect rates to rise from current levels, they should remain low by historical standards for several reasons: slower growth in the labor force, diminishing productivity growth, and continued strong demand for U.S. Treasuries from the European Central Bank and the Bank of Japan.

Footnotes:
1. Investopedia: yield curve definition
2. Congressional Budget Office Report, "The Budget and Economic Outlook: 2017-2027," January 2017.

Investing involves risk, including possible loss of principal, and investors should carefully consider their own investment objectives and never rely on any single chart, graph or marketing piece to make decisions. Indices are unmanaged, do not consider the effect of transaction costs or fees, do not represent an actual account and cannot be invested to directly. The information contained in this piece is intended for information only, is not a recommendation to buy or sell any securities, and should not be considered investment advice. Please contact your financial adviser with questions about your specific needs and circumstances.

The information and opinions expressed herein are obtained from sources believed to be reliable, however their accuracy and completeness cannot be guaranteed. All data are driven from publicly available information and has not been independently verified by Cambridge Wealth Management, LLC. Opinions expressed are current as of the date of this publication and are subject to change. Certain statements contained within are forward-looking statements including, but not limited to, predictions or indications of future events, trends, plans or objectives. Undue reliance should not be placed on such statements because, by their nature, they are subject to known and unknown risks and uncertainties.