Investment Strategy

Q3 2020 Market Review & Outlook: Expect the unexpected

Bull & Bear with masks.jpg

The market’s better-than-expected V-shaped recovery since the spring lockdown was derailed briefly by a September correction that approached 10% in many mega-cap momentum stocks. The S&P 500 index advanced 8.9% and the Wilshire 5000 total market index of U.S. stocks gained 5.54% through Q3.

Outlook: 3 Things to Watch:

As one thinks about the next few months and into 2021, the economy’s outlook is complicated by the election, the path of the pandemic, and the stalemate over the passage of another fiscal stimulus program. Election uncertainty is going to be the dominant issue over the next few weeks.

  1. Election 2020: Déjà vu?:

A Biden presidency and potential Democratic sweep would likely mean higher corporate taxes and higher taxes on investment gains. However, a Democratic boost in federal spending could offset any downside from tax hikes and more regulation, according to many Wall Street strategists.

Trump’s business and brief political history has proven that he’s resilient and has Teflon qualities. And, he could surprise the political pundits again in 2020. The race is still too close to call, and there is a very high risk the election could be unresolved on Election Day — markets would not react favorably to that sort of chaos.

Many of Wall Street strategists believe the current price action in markets is signaling a blue wave. Despite all the theories about the markets’ remarkable V-shaped recovery rooted in political bias, markets are apolitical. They care more about who’s in charge at the Federal Reserve Bank. Indeed, price action has been driven by a supportive Fed coupled with the CARES Act.

As we witnessed in 2016, market players are not particularly good at forecasting how the market will react if a Democrat or Republican wins. History shows that the market will likely do better with two more years of gridlock, no matter who wins the White House.

2. Covid-19 Vaccine:

The year 2020 has been filled with numerous surprises no fiction writer could have contrived. There is still the risk that the second wave of Covid-19 will hit the nation at some point, but the market’s price action does not indicate a willingness to embrace a pessimistic view. It seems that the market is anticipating an effective vaccine, which will likely prevent another shutdown, like the one we saw in the spring. Until a safe vaccine is developed and available, the consumer will be reluctant to spend and travel. Many biotech analysts believe a vaccine could be 80 - 90% effective, worst case 70%. According to market veteran Art Cashin of UBS, the markets may be far too complacent in believing that a highly effective vaccine is imminent. Only time will tell.

3. Stimulus:

The U.S. CARES Act proved to be financially beneficial to those impacted by the pandemic shutdown. But the U.S. economy needs another jolt after suffering through the pandemic, and it cannot recover without it. The Fed has done its job on the monetary side. Its quick and aggressive efforts provided necessary stimulus and liquidity to keep the economy from falling into a deep depression. At $7 trillion, the Fed's balance sheet is bloated, and it cannot stimulate growth and the economy — it can only buy time and provide a floor for market volatility.

In a morning note on October 19, 2020, Joe Weisenthal, an editor at Bloomberg wrote: “This has got to be one of the prime lessons of 2020: When it comes to economic outcomes, the state (at least in the developed world) is incredibly powerful. When the virus came and threatened to obliterate household income this spring, Congress moved quickly and passed the CARES Act — spending trillions of dollars to make up for that. Today, both household net worth and total retail sales are above pre-crisis trends.”

Picture1.png

The second round of stimulus will represent nearly 10% of our annual GDP and turbocharge the recovery. However, neither side seems genuinely interested in helping the economy or the people. It seems they fear the optics of giving the other side a “win” so close to the election. Democrats have been seeking $2.2 trillion in new stimulus, and Senate Republicans have said they would hold new spending closer to $1 trillion. President Trump has offered $1.8 trillion, and it was rejected yet again by Speaker Pelosi.

Stocks & Bonds:

Corporate Earnings:

Due to the pandemic, corporate America is leaner, and it should lead to strong Q3 earnings for many companies outside the oil patch. Quarterly results over the next month and a half will give institutions a chance to decide whether it's time to take profits or put cash back to work and build larger positions.

In a recent Investor’s Business Daily (IBD) article by David Saito-Chung, he quotes a daily note from Steven Ricchiuto, chief economist at Mizuho Securities USA: "These quarterly estimates imply a full-year decline of 18.6%. The same bottoms-up estimates look for a 25.7% rebound in earnings next year. Earnings per share are expected to total $127.70 this year and $165.12 next year. The implied multiple of 25.9x this year is generally seen as compressing to 21.5x in 2021,"

Note: Current lofty valuations in the market can only be justified in the context of a zero interest rate policy (ZIRP), and many stocks, especially technology names, are vulnerable should interest rates start to move higher. Further, Biden’s plan to hike corporate tax will hit earnings. Lower earnings combined with lower multiples isn’t a great formula for higher share prices.

Bond Market: Keep an eye on interest rates.

Real U.S. interest rates (adjusted for inflation) are now negative. The election could impact the bond market, and the make-up of the Senate is a key. Let’s suppose former vice president Joe Biden is elected, and the Senate turns to Democrat control. In that case, markets expect stimulus spending to be much greater leading to a weaker dollar and yields. A weaker dollar would usually be a positive catalyst for equities, particularly large-cap multinationals and energy-based commodities.

Many hedge funds are currently short the dollar, meaning they expect it to weaken in the year ahead. What if they’re on the wrong side of the trade and we begin to experience a stronger dollar?

The yield on the benchmark U.S. Treasury 10-year bond spiked to 0.84% this past week. That marked the highest level since early June. The Fed would like to boost inflation, and they may get their wish, depending on the outcome of the election. An economic recovery is in the future and it’s something that could push yields higher. If we move into a higher inflationary environment, both equities and bonds can go down as bond yields move up. In my opinion, we will eventually get inflation because the Fed’s action has assured it. The big question is: Will job creation and solid growth accompany it, or will we end up with stagflation (no growth and inflation)?

The Bottom Line: Brace for the unexpected

The S&P 500 has been corralled at 3,200 to 3,400 for four weeks. The index moved lower on headlines after the first presidential debate and Trump’s positive Covid-19 test, and each time it has bounced from around 3,300. The S&P 500 closed at 3465.39 on Friday, October 23. The markets are coiling and compressing as they process unexpected events and political election intrigue, building up energy for eventual release, up or down.

Right now, the market is "hoping" that we have a stimulus deal and effective vaccine, but there is a good chance that we do not get either one for some time, at least until after the election. Many market participants are overhedged due to concerns over the second wave of COVID-19, a failure in stimulus negotiations, and election outcomes. As such, we have not witnessed a period of sustained selling pressure. And, the Fed’s aggressive action to help support asset prices have helped dampen volatility.

The VIX (Volatility Index)

One last thought: Will China make good on its promise to purchase $200 billion in U.S. goods, guaranteeing an export boom in 2021? President Trump’s much-touted trade deal has crashed and burned with the Pandemic. His promise to protect American workers from China’s trade practices resonated politically and was almost certainly a decisive factor in his surprising victory in 2016. Under the phase one deal signed in January 2020, China pledged to buy $200 billion of U.S. goods over the next two years, including about $50 billion in two years for oil and gas; $80 billion for engineering equipment; and $32 billion in agricultural products. Since jetliners are the biggest U.S. manufactured export to China, a high-profile Boeing jet purchase would undoubtedly be involved. According to the latest numbers from the Petersen Institute for International Economics: “Through August 2020, China’s year-to-date total imports of covered products from the United States were $56.1 billion, compared with a prorated year-to-date target of $115.1 billion. Over the same period, US exports to China of covered products were $47.6 billion, compared with a year-to-date target of $95.1 billion.”

The markets are banking on a significant reopening of the economy beginning in the first quarter of 2021, with more expansion in the second quarter. Earnings estimates reflect that optimism: S&P 500: 2021 earnings (year-over-year estimates), Q1: up 14%, and Q2: up 44%.

CWM portfolios hold higher cash levels relative to their benchmark model allocations, at this juncture, given my cautious position towards risk assets. For now, the economy’s outlook is complicated by the election, the path of the virus and vaccine news, and a fiscal stimulus program on hold.

IMPORTANT DISCLOSURES: This information is educational in nature and is not intended to provide specific investment advice, a financial promotion, or an inducement ,or incitement to participate in any product, offering, or investment. Cambridge Wealth Management is not adopting, making a recommendation for, or endorsing any investment strategy or particular security. The opinions and information expressed herein are obtained from sources believed to be reliable. However, their accuracy and completeness cannot be guaranteed. All data is driven from publicly available information and has not been independently verified by Cambridge Wealth Management, LLC. Some of the conclusions in this report are intended to be generalizations. Any economic forecasts and statements set forth may not develop as predicted and are subject to change. Undue reliance should not be placed on such statements because, by their nature, they are subject to known and unknown risks and uncertainties. There is no assurance that the views or strategies discussed are suitable for all investors or will yield positive outcomes. Investing involves risks including the risk of possible loss. Past performance is not a guarantee of future results.

INDEX DESCRIPTIONS:
The following descriptions, while believed to be accurate, are, in some cases abbreviated versions of more detailed or comprehensive definitions available from the sponsors or originators of the respective indices. Anyone interested in such further details is free to consult each such sponsor’s or originator’s website. Each index reflects an unmanaged universe of securities without any deduction for advisory fees or other expenses that would reduce actual returns, as well as the reinvestment of all income and dividends. An actual investment in the securities included in the index could require an investor to incur transaction costs, which would lower the performance results. Indices are not actively managed and investors cannot invest directly in the indices.

S&P 500®: Standard & Poor's (S&P) 500® index. The S&P 500® Index is an unmanaged, capitalization-weighted index designed to measure the broad U.S. economy's performance through changes in the aggregate market value of 500 stocks representing all major industries.

COVID-19 Investment Playbook – CWM Special Report

Market corrections happen, but the speed of this decline was the fastest 10%+ one since the Great Depression. The extreme whipsaw moves we witnessed occurred because the market is attempting to reprice risk assets based on outcomes ranging from a brief pause in Q2 economic growth to a global pandemic and recession.

Summary

  • While economic risks are rising, I do not believe the U.S. is heading for a recession or prolonged bear market. Given the risks to Q2 earnings, I am lowering our S&P 500 year-end target from 3400 to 3200.

  • The market was overvalued in certain areas as I stated in our Market Outlook: Investment Themes for 2020, but valuations are not as stretched as they were during the housing bubble and dot-com era. This is not a 2000- or 2008-style correction.

Don’t bet against the Fed

As my brother Michael, an astute economist, stated on March 1: “We are witnessing a supply-driven shock that the world has never experienced before. There’s no playbook for this one.” The novel COVID-19 virus continues to spread outward from China causing widespread fear. The good news is that the Fed and other central banks were proactive, instead of reactive, and moved this past week to stabilize markets by providing additional liquidity. However, it’s not enough. The Fed and the Whitehouse need to embrace a "whatever it takes" mentality. Trading algorithms need to shift from “what if” to “what will” scenarios and this requires a clear plan from our government.

Some market pundits have criticized the Fed’s recent move because they believe monetary policy cannot cure a non-financial “black swan-type” event. However, lower rates will help interest rate-sensitive companies refinance debt — companies that otherwise could find themselves in violation of debt covenants. There are trillions of dollars of debt owed by businesses and refinancing could help a company weather the current storm, potentially taking advantage of opportunities as animal spirits get stirred.

Collapsing oil prices, empty malls, and idling airplanes will have cash flow implications, which could lead to a slowdown in business spending and bankruptcies. However, it’s an overreaction by markets to assume that the global downturn caused by a supply-driven shock and Wuhan virus could lead to a major credit event.

Corporate Profits

Corporate profits likely will come under severe pressure around the world in the months ahead. The sudden oil price collapse and bond market are signaling a global recession. Many market participants fear that we could see more market capitulation in the near-future as Wall Street analysts lower their estimates.

Analysts had conservative forecasts heading into 2020. I noted in Market Outlook: Investment Themes for 2020 that, according to FactSet Earnings Insight, January 10, 2020, “Targets & Ratings: Analysts Project 6% Increase in Price Over Next 12 Months. The bottom-up target price for the S&P 500 is 3,474.50.

Valuations: Cheap or trapdoor?

Investors may be wondering whether the pullbacks represent buying opportunities or a “value trap” that could lead to more losses. While valuations are more attractive than they were a few weeks ago, it’s a secondary consideration to economic fundamentals, which continue to deteriorate.

I continue to reevaluate tactical positions in light of these current weakening fundamentals. Certain investment themes and names that I liked a month ago look even more appealing now. However, longer-term shocks to supply-and-demand could lead to lower valuations for stocks as investors discount future earnings more aggressively due to persistently slower growth.

Strategy and outlook

Time vs. timing the market

We could remain in a choppy market environment for months. Cambridge model portfolios held high cash positions relative to their strategic asset allocation heading into this market meltdown.

I stated in Market Outlook: Key Investment Themes for 2020 that the market was overvalued and current exuberance needed a healthy dose of reality. However, positioning portfolios to their fully invested strategic asset allocation will depend on the containment of the COVID-19 virus over the coming weeks, improving market fundamentals, and a coordinated, clear plan from the White House.

JP Morgan’s global asset strategist, Marko Kolanovic, said in a note to clients on Wednesday: “The hit to the global economy during the first quarter will largely be made up later in the year. The world economy will bounce back quickly from the coronavirus outbreak, and investors should buy into cyclical stocks to catch the comeback.” Indeed, when we do see an eventual rebound, I believe deep cyclical sectors and value styles could outperform.

Market bottoms are impossible to time. But, if one focuses on buying great assets at discounted prices while balancing risk and return, Cambridge Wealth Management’s clients will benefit in the long run.

IMPORTANT DISCLOSURES: This information is educational in nature and is not intended to provide specific investment advice, a financial promotion, or an inducement or incitement to participate in any product, offering or investment. Cambridge Wealth Management is not adopting, making a recommendation for or endorsing any investment strategy or particular security. The opinions and information expressed herein are obtained from sources believed to be reliable. However, their accuracy and completeness cannot be guaranteed. All data is driven from publicly available information and has not been independently verified by Cambridge Wealth Management, LLC. Some of the conclusions in this report are intended to be generalizations. Any economic forecasts and statements set forth may not develop as predicted and are subject to change. Undue reliance should not be placed on such statements because, by their nature, they are subject to known and unknown risks and uncertainties. There is no assurance that the views or strategies discussed are suitable for all investors or will yield positive outcomes. Investing involves risks including possible loss of principal.

INDEX DESCRIPTIONS:
The following descriptions, while believed to be accurate, are in some cases abbreviated versions of more detailed or comprehensive definitions
available from the sponsors or originators of the respective indices. Anyone interested in such further details is free to consult each such sponsor’s or originator’s website. Each index reflects an unmanaged universe of securities without any deduction for advisory fees or other expenses that would reduce actual returns, as well as the reinvestment of all income and dividends. An actual investment in the securities included in the index could require an investor to incur transaction costs, which would lower the performance results. Indices are not actively managed and investors cannot invest directly in the indices.

S&P 500®: Standard & Poor’s (S&P) 500®) index. The S&P 500® Index is an unmanaged, capitalization-weighted index designed to measure the performance of the broad US economy through changes in the aggregate market value of 500 stocks representing all major industries.

Market outlook: Investment Themes for 2020

Tokyo Bay

Tokyo Bay

A year ago, few could have imagined the S&P 500 delivering a gain of more than 31.5% in 2019 (including dividends) with flat earnings. Volatility was extreme in Q4 2018 and a sell-off in December 2018 left the S&P 500 near bear market territory (defined as a 20% decline from its closing peak). Accounting for compounding returns, the near 20% decline suffered by the S&P 500 in Q4 2018 required a 25% rebound to get back to even.

Throughout 2019, we went from concerns of a bear market to recovery only to have recession fears resurface in the third quarter as trade friction and China’s slowing economy rattled markets. We began Q4 2019 at about S&P 500 2930 level — the market treaded water, so to speak, for nearly 18 months.


2019 performance for key indices:

Equity market:

• S&P 500: 31.5% (including dividends)
• MSCI EAFE: (index of developed market economies): 22%
• MSCI Emerging Markets Index: 18.5%

Bond market:

• Barclays U.S Aggregate Index: 8.7%
Intermediate-term municipal bonds: 5.7%

Real assets:

• Spot gold returned 18.5%.
• REITs gained more than 20%.
Note: UBS tracks 18 asset classes to include in its year-end investor report, and all asset classes reported positive returns compared to only two in 2018 (cash and bonds).

Apple and Microsoft accounted for nearly 15% (almost half including dividends) of the S&P 500 index returns in 2019.

Top Contributors_2019.png


A change of heart at the Fed

So, what changed to finally break the market’s range-bound movement? Our president stopped tweeting about the U.S.- China trade war. Seriously: Much of the stock market’s gains in 2019 can be attributed to a dramatic policy shift at the Federal Reserve.

In 2018, the Fed raised rates four times, including a December 2018 hike that took its key rate to 2.5%, sending a major shockwave throughout global markets. However, in 2019, the Fed lowered rates three times, in one-quarter percentage point steps, due to concerns over a slowing global economy tied to trade war concerns and lackluster business spending. And for an added safety measure, the Fed announced the buying of Treasury bills in September to stabilize the short-term repo market. The Fed’s intervention injected the market with an extra boost to liquidity and investor confidence.

GDP Chart.png

Gross domestic product (GDP) in the U.S. is expected to slow to about 2.0% in 2020, down from 2.2% in 2019 and well off the “sugar highs” induced by the 2017 tax cut package.


Trade deals Signed

We spent much of the year being whipsawed by the U.S.- China trade war headlines and our president’s erratic tweets on the subject.

As the year came to a close, the House passed the United States-Mexico-Canada Agreement, which is President Trump’s replacement for NAFTA. Equally important, the Trump administration came to a phase-one trade agreement with China. All in all, very welcome news for markets.

Trump’s China tariffs and the uncertainty surrounding them were troubling U.S. businesses that have built supply chains in China or that rely on Chinese imports. Their concerns were a reason U.S. businesses’ capital investment fell throughout the year.

pmi_vs_sp500_2019.png


Looking ahead: Key themes for 2020

Corporate earnings: Paying up

As we enter 2020, markets are riding high. Indeed, the mood is ebullient as we experience a continued “melt-up” in markets. The market rally has been driven by expectations of a snap-back in earnings growth and a synchronized global economic recovery.

Price/earnings (P/E) ratios rose to 18.3 forward earnings for the S&P 500 from 15.6 a year ago. The P/E multiple expansion resulted from a decline in interest rates. Are markets expensive? Multiplying the current P/E of 18.4 times the consensus S&P earnings estimate for 2020 of $177.88 results in an index level of 3,202. Based on these forecasts, the market is overvalued at current levels.

According to FactSet Earnings Insight, January 10, 2020:
Targets & Ratings: Analysts Project 6% Increase in Price Over Next 12 Months. The bottom-up target price for the S&P 500 is 3474.50. At the sector level, the Energy (+12.7%) sector is expected to see the largest price increase, as this sector has the largest upside difference between the bottom-up target price and the closing price. On the other hand, the Information Technology (+1.7%) sector is expected to see the smallest price increase.”

Earnings growth estimates were down drastically this past year. Analysts estimated S&P 500 earnings growth for the year would be around 7.6%, according to FactSet. That number is now about 0.3% or flat.

A key theme to watch in 2020 will be companies ability to continue to grow earnings and meet current expectations.

Portfolio implications for 2020:
Sector profit margins at risk of earning misses are Consumer Staples, Industrials, Technology, Consumer Discretionary, and Basic Materials sectors where 25% tariffs on $250 billion array of Chinese industrial goods and components used by U.S. manufacturers remain in place. Note: The fierce rotation into value that began in September, led by major banks like JP Morgan (a beneficiary of the U.S.-China Trade deal) still has room to run.

Some key earnings forecasts to watch this month: Apple, Amazon, and Boeing.
The market has bid up Apple shares, anticipating strong growth from Services. Some analysts are predicting production cuts in March for the iPhone 11 line (iPhone 11 Pro retails for $1149) in Chinese markets due to low demand and increasing headwinds from aggressive 5g smartphone launches in China by Huawei. Apple has fallen behind Asian competitors in its 5g product launch.

Deglobalization or Fair Trade?

What began as campaign rhetoric became reality when president Trump announced his trade reform agenda at the World Economic Forum at Davos in January 2018. He stated: “The United States will no longer turn a blind eye to unfair economic practices, including massive intellectual property theft, industrial subsidies, and pervasive state-led economic planning. These and other predatory behaviors are distorting the global markets and harming businesses and workers, not just in the U.S., but around the globe…The United States is prepared to negotiate mutually beneficial, bilateral trade agreements with all countries.

A phase-one trade deal is important from a psychological perspective because it removes some of the fog of uncertainty clouding business activity for the current fiscal year. A phase-two trade deal with China will not be negotiated until after the 2020 elections. Going forward, we should see a pickup in capital expenditures.

Overseas, growth continues to be more challenging than in the U.S, but green-shoots are emerging and valuations are attractive. The U.K. is expected to negotiate a favorable trade agreement with continental Europe and a soft-landing for Brexit is now widely anticipated.

Portfolio implications for 2020
Trade wars, tariffs, and talk of more tariffs have created a cautious business atmosphere, restraining investment, and concomitant global growth. While a phase-one deal has provided clarity for businesses, trade will remain a top policy issue throughout 2020 and beyond.

In November 2019, the FCC labeled Huawei and ZTE a national security threat and cut Federal funding going to equipment from these companies. Huawei, now the world’s largest telecommunications equipment manufacturer and second-largest smartphone manufacturer, is currently appealing the ban, deeming it unconstitutional. Additionally, the Trump administration has banned U.S companies from doing business with Huawei. In November, the U.S gave Huawei a third 90-day support window that allows current Huawei customers to continue to receive support for existing devices from U.S companies who apply for a “general export license.” The U.S. is also requesting Meng Wanzhou, Huawei’s CFO, be extradited and tried for fraud.

Huawei map.png

Countries and companies that rely heavily on exports who adapt quickly to this changing trade dynamic as they plan capital expenditures and rethink their supply chains will fare better than those who don’t. Earnings for Google Mobile Services(GMS) and certain semiconductor manufacturers could be negatively impacted should the U.S. fail to grant Huawei a fourth 90-day support window. Note: Chinese companies stockpiled U.S. semiconductors in 2018, but inventories are now running low. Huawei is developing their own mobile services, called HMS, to replace Google.

The Fed and Central Banks: On hold?

It appears the recent rate cuts by our Fed have been enough to extend the economic cycle. Bond yields generally remain in their lowest decile relative to history thanks to easy monetary policy and subdued credit conditions. While the Fed is usually on hold during an election year, it may be forced to cut rates again due to concerns over a slowing economy and cautious business spending.

Portfolio Implications for 2020
Interest rates should remain range-bound with the 10-year U.S. Treasury bond trading between a yield of 1.75% and 2.0%. The current rate environment will continue to support an elevated P/E ratio of 18. Companies should continue to take advantage of low rates and buy back shares of their stock, helping boost prices as supply is reduced. Unlike the rally in 2019, Bond returns will likely remain constrained due to dovish central banks and soft global growth. Investors should stick with investment-grade corporates for taxable accounts and avoid reaching for yield this late in the cycle.

U.S. Elections: Facebook, Google, Healthcare, and Energy in focus

First, a word about impeachment. The consensus view is that the current situation is similar to president Bill Clinton's impeachment in 1998, which didn’t affect markets. Perhaps the current impeachment proceeding is more about the Democrats taking control of the Senate? Four Republican senators are at risk: Martha McSally (Arizona), Cory Gardner (Colorado), Joni Ernst (Iowa), and Susan Collins (Maine).

As always, the big wild card to market forecasts this year will be the 2020 elections, though markets likely won’t focus on this X-factor until June. I should note, even though the market’s performance has generally been positive in election years, the gains usually come later.

Many things are going right. With central banks now acting in sync with each other and new trade deals in place, talks of a synchronized global recovery have resurfaced. Improving corporate earnings, business confidence, and an accommodative Fed should help drive market gains in 2020. In all, I expect a good year for financial markets, but as always, I’m prepared for the inevitable surprises that could impact my outlook. Trade frictions with China centered on Huawei and their CFO could heat up again in March as business support exemptions expire, giving current exuberance a healthy dose of reality.

IMPORTANT DISCLOSURES: This material is for general information only and is not intended to provide specific advice or recommendations for any individual. The opinions and information expressed herein are obtained from sources believed to be reliable. However, their accuracy and completeness cannot be guaranteed. All data is driven from publicly available information and has not been independently verified by Cambridge Wealth Management, LLC. Opinions expressed are current as of the date of this publication and are subject to change. Some of the conclusions in this report are intended to be generalizations. There is no assurance that the views or strategies discussed are suitable for all investors or will yield positive outcomes. Investing involves risks including possible loss of principal. Any economic forecasts set forth may not develop as predicted and are subject to change.

INDEX DESCRIPTIONS:
The following descriptions, while believed to be accurate, are in some cases abbreviated versions of more detailed or comprehensive definitions
available from the sponsors or originators of the respective indices. Anyone interested in such further details is free to consult each such sponsor’s or originator’s website. Each index reflects an unmanaged universe of securities without any deduction for advisory fees or other expenses that would reduce actual returns, as well as the reinvestment of all income and dividends. An actual investment in the securities included in the index could require an investor to incur transaction costs, which would lower the performance results. Indices are not actively managed and investors cannot invest directly in the indices.

S&P 500®: Standard & Poor’s (S&P) 500®) index. The S&P 500® Index is an unmanaged, capitalization-weighted index designed to measure the performance of the broad US economy through changes in the aggregate market value of 500 stocks representing all major industries.

U.S.-China Trade War: Could it get any uglier?

A day will come when there will be no battlefields, but markets opening to commerce and minds opening to ideas.
— Victor Hugo

Trade tensions between the United States and China show no signs of simmering down. A new round of U.S. tariffs on Chinese imports kicked in on August 22. The U.S. began collecting an additional 25 percent in duties on $16 billion in Chinese import product categories including semiconductors, chemicals, and motorbikes, just to name a few. These latest American tariffs come on the heels of $34 billion in Chinese goods duties levied at 25 percent, which were implemented in July.

Beijing immediately retaliated with tariffs of their own on $16 billion worth of additional imports from the U.S. including fuel, steel products, autos, and medical equipment.
 

In brief:

  • Basic materials, industrials, and emerging markets have all taken a hit in recent months due to the trade wars. Turbulence will be around for awhile particularly in emerging markets.

  • Markets should expect bilateral tit-for-tat trade actions to continue for the foreseeable future for both the U.S. and China. With approaching midterms, China is playing a waiting game.

  • The objective is to reduce the size of the U.S. - China trade deficit from an estimated $370 billion to $200 billion by 2020 and eliminate unfair trade practices noted below.

August 6, 2018 - prior to recent round of 16b in tariffs

August 6, 2018 - prior to recent round of 16b in tariffs


The issues:

At the core of the trade war issues on the U.S. side are concerns over technology infringement and alleged widespread intellectual property (IP) theft by the Chinese. This comes from three activities:

  • Corporate espionage,

  • Cyber-theft, and

  • Technology transfer to the Chinese in exchange for market access.

The Commission on the Theft of American Intellectual Property estimates that China's purported IP theft costs the U.S. between $225 billion and $600 billion each year. http://ipcommission.org

China has denied Washington's allegations that it essentially forces the unfair transfer of U.S. technology in exchange for market access and insists it adheres to World Trade Organization rules.

Instead of tit-for-tat trade tariff retaliation with the U.S., China should follow South Korea's lead and accept to bring down their large surplus on American trades and rebalance a relationship that has served them so well.


The art of the deal

The prevailing wisdom on President Trump's trade tactics is that he's making major negotiation errors in his attacks on China and that nobody can win a trade war. Regardless of the Trump administration’s current trade war strategy with China, I think that things could change quickly for China in the coming months leading to two very different potential market outcomes in Q4. China wants U.S. business interests to pressure President Trump, and it’s betting on scenario one below.

Scenario 1: A “Blue Wave” in the House this November gives the Democrats a mandate to impeach Trump if the Special Counsel report proves some form of perjury or Russian collusion. President Trump is likely to survive indictment in the Senate, but "Never Trump" Republicans could vote to replace him with Vice President Mike Pence. Note: The billionaire Koch brothers have financed the Vice President’s political career, and therefore, he would likely carry their “free trade” globalist torch.

Scenario 2: The Special Counsel finds no Russian Collusion or wrongdoing by the Trump administration, there’s a “Red Wave” in November midterms, and President Trump is given the mandate to move forward with his populist agenda and impose tariffs on a total of $500 billion of Chinese imports.

So, what’s the real U.S. endgame in this trade war with China? It's this: Redirect global supply chains to favor American manufacturers; pressure China to open its market to Americans with no strings attached; reduce the trade deficit, and challenge Chinese dominance in Asia.
 

The bottom line:

Shangai index 620x-1.png

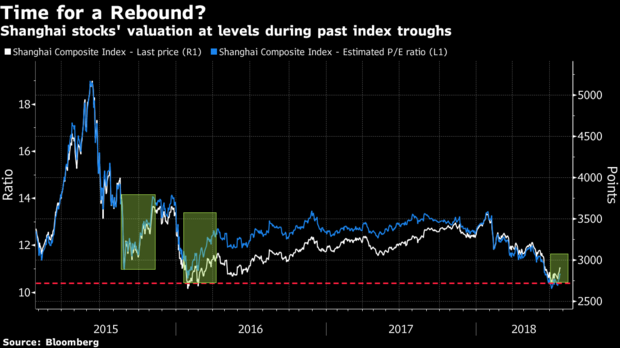
China's President Xi Jinping is feeling the heat and it looks like he may have overreached. Trade tensions have exposed vulnerabilities in China's slowing economy, and it’s making investors nervous. A tanking Chinese stock market and resulting investment outflows could lead to an uptick in emerging market bond yields and the winter of discontent in China. Even worse, a full-blown trade war would have stagflationary consequences globally.

A few days ago, veteran Wall Street trader Art Cashin of UBS mentioned on CNBC that markets seem to be pricing in the “Pence Put.” A put is a option contract giving the owner the right to to sell a specified amount of an underlying security at a specified price within a certain time frame, limiting downside market risk. Either the market is looking beyond the trade war and midterm elections and pricing in a "Pence Put" or it's having a lagging reaction to significant regulatory rollback and Trump's Tax Cuts and Jobs Act of 2017 (TCJA).

The future is capricious (especially in the Trump era), which is partially the reason why markets exist in the first place. The market conditions that led to February’s spike in the VIX (volatility index) — rising rates, less liquidity, and hedge funds being caught wrong-footed — are still there. With the unprecedented confluence of political and trade events added to these pre-existing conditions, the likelihood of a spike in volatility calls for underweighting equities relative to their strategic asset allocation and holding higher levels of cash. Depending on the outcome of the November midterms and the Mueller investigation, the U.S. - China trade war could get even uglier in the months ahead as trade policy scripts get torn up and rewritten.
 

Sources: Wall Street Journal Online; Bloomberg News; Investor’s Business Daily; Forbes.com; CNBC News; Reuters News; The Economist.

The information contained in this piece is intended for information only and should not be considered investment advice. Please contact your financial adviser with questions about your specific needs and circumstances.

The information and opinions expressed herein are obtained from sources believed to be reliable, however their accuracy and completeness cannot be guaranteed. All data are driven from publicly available information and has not been independently verified by Cambridge Wealth Management, LLC. Opinions expressed are current as of the date of this publication and are subject to change. Certain statements contained within are forward-looking statements including, but not limited to, predictions or indications of future events, trends, plans or objectives. Undue reliance should not be placed on such statements because, by their nature, they are subject to known and unknown risks and uncertainties.

Ready Your Bond Portfolio For Reflation

photodune-7203994-business-documents-m.jpg

In Brief:

  • Donald J. Trump’s surprise election victory is a sea change, opening the way for substantial tax and regulatory reforms that should lead to reflation: improving growth, wage gains, and concomitant inflation.

  • Post-election, the shorter end of the yield curve immediately steepened, suggesting bond investors see more growth in the near term. However, the long end of the yield curve has flattened, signaling that fiscal stimulus now may become a fiscal drag over the long term.
     
  • We expect to see a modest rise in the 10-year Treasury from the current level of about 2.4 percent (watch 2.60 percent level).
     

The Yield curve "Tell"

First, let’s begin by defining a yield curve. A yield curve is a line that plots the interest rates, at a point in time, of bonds having equal credit quality but differing maturity dates. The most commonly reported yield curve compares the three-month, two-year, five-year, 10-year, and 30-year U.S. Treasury debt. [1}

Read more: Yield Curve Definition | Investopedia

The yield curve reflects the collective wisdom of millions of bond investors, and historically, it has been a strong predictor of economic booms and busts. The steepness or flatness of the yield curve is an indication of economic growth. The steeper the curve, the more investors expect inflation and interest rates to rise in the future. Conversely, when the yield curve flattens (or inverts -- shorter-term rates are higher than long-term rates), then investors expect a slowing economy. Also, our Federal Reserve Bank’s buying programs exert influence on the shape of our yield curve.

With the post-election spike in the 10-year Treasury, the bond market is telling us that Trump’s proposed policies are reflationary (see chart below). Over the short run, the bond market is signaling that moderately improving economic growth will lead to gradually rising interest rates. However, the long end of the yield curve has flattened, which means that Trump’s fiscal stimulus plans of lower tax rates and trillion-dollar infrastructure spending could become an economic drag later. And if Trump’s policies add to our $20 trillion in national debt, future costs of servicing our national debt due to higher interest rates could present a real drag on GDP.


The congressional budget office numbers

Each year in February, we review the CBO Budget and Economic Outlook report. According to this year’s report:
“As the slack in the economy continues to diminish, the Federal Reserve will continue to reduce its support of economic growth, in CBO’s view. Thus, the federal funds rate — the interest rate that financial institutions charge one another for overnight loans of their monetary reserves — is expected to rise gradually over the next few years, reaching 1.1 percent in the fourth quarter of 2017 and 1.6 percent in the fourth quarter of 2018, and 3.1 percent in the later part of the projection period. [2]
 

Our bond portfolio base case

  • We advocate holding Treasury Inflation-Protected Securities (TIPS) in bond portfolios.
  • We favor shortening interest rate exposure. (Floating rate bonds look pricey).
  • We prefer financial paper, selective U.S. fixed rate bank preferreds, and investment-grade corporate bonds over Treasuries.
  • President Trump's proposed tax reforms could reduce the attractiveness of municipal bonds and presents risks for investors.
  • We recommend a simple laddered bond strategy.

Historically, the sweet spot in the yield curve during a rising rate environment has been the five-to-seven-year maturity range. While we expect rates to rise from current levels, they should remain low by historical standards for several reasons: slower growth in the labor force, diminishing productivity growth, and continued strong demand for U.S. Treasuries from the European Central Bank and the Bank of Japan.

Footnotes:
1. Investopedia: yield curve definition
2. Congressional Budget Office Report, "The Budget and Economic Outlook: 2017-2027," January 2017.

Investing involves risk, including possible loss of principal, and investors should carefully consider their own investment objectives and never rely on any single chart, graph or marketing piece to make decisions. Indices are unmanaged, do not consider the effect of transaction costs or fees, do not represent an actual account and cannot be invested to directly. The information contained in this piece is intended for information only, is not a recommendation to buy or sell any securities, and should not be considered investment advice. Please contact your financial adviser with questions about your specific needs and circumstances.

The information and opinions expressed herein are obtained from sources believed to be reliable, however their accuracy and completeness cannot be guaranteed. All data are driven from publicly available information and has not been independently verified by Cambridge Wealth Management, LLC. Opinions expressed are current as of the date of this publication and are subject to change. Certain statements contained within are forward-looking statements including, but not limited to, predictions or indications of future events, trends, plans or objectives. Undue reliance should not be placed on such statements because, by their nature, they are subject to known and unknown risks and uncertainties.

2016 Presidential Election & Your Portfolio

After Labor Day, the race for the White House will shift into high gear. Aside from the brief bump post-GOP convention, Trump has consistently lagged Clinton in the polls. However, it’s still too early for Hillary to begin picking out her drapes for the White House. According to a recent CNN Poll of Polls, the race is back to its pre-convention levels. Clinton holds an average of 42% support to Trump's 37% across five nationwide polls.

No matter who wins in November, one thing is sure — the next two months promises to be filled with unprecedented drama – like no other presidential election.
 

It’s all about the economy

In the end, elections come down to the economy — jobs, wages, and trade. In this respect, the differences between the two presidential candidates are significant. With that stated, it’s important for investors to understand global economic and market implications under two very different presidencies.
 

On Global Trade

Markets prefer certainty over uncertainty — who doesn’t. For the most part, the markets suspect they know what they are getting with a Clinton presidency and should react less negatively to a Clinton victory.

About 40 percent of the S & P 500 companies generate about 40 percent of their revenues from global trade, and it should be business as usual under a Clinton presidency.

Unlike Clinton, Trump promises to renegotiate our trade agreements because he believes they are simply “terrible.” The author of the “Art of the Deal” will use his deal making skills to renegotiate trade deals that are "fair." His protectionist rhetoric could make for profound instability in global markets. In fact, markets are scared to death of Trump’s unpredictable patterns of behavior.


The financial sector

Under a Clinton administration, financial service companies will be hit with even more regulation. Hillary is also a big supporter of the Consumer Financial Protection Bureau promulgated by her close ally, Elizabeth Warren. New rules will increase costs for the financial companies, yet paradoxically, the financial sector is rising in the belief that a Clinton presidency will be better for the economy. Again, markets prefer certainty.

On the other hand, Trump plans to roll back Dodd-Frank and eliminate the Consumer Financial Protection Bureau. Similar to Bernie Sanders, he promises to bring back an updated version of the Glass-Steagall Act (which should never have been repealed in 1999). The Glass–Steagall Act describes four provisions of the U.S. Banking Act of 1933 that limited securities, activities, and affiliations within commercial banks and securities firms.[1] In theory, this should be better for the economy as it unleashes growth and profits for the smaller regional/community banks and reigns in Wall Street and big government spending.


The healthcare sector

The healthcare sector will be facing a very different set of pressures from the two administrations.

Clinton will be tough on the pharmaceutical and biotech sector. However, she will be positive for managed care stocks.

Trump promises to repeal the Affordable Care Act known as Obamacare, a negative for managed care names. He is a positive for big pharma/biotech by his promise of less regulation. He also vows to open state health insurance markets to more competition by eliminating "the lines around states."


The Energy Sector

No matter who wins the presidential race, the energy industry is plagued with an oversupply of both oil and natural gas. Countries are producing more oil than current demand, thanks to technology, putting downward pressure on prices. When it comes to this sector of the market, government policy is very different for the two nominees.

Clinton will continue to promote alternative, “green energy” and discourage fossil fuels, particularly coal.

Trump, however, will promote the XL pipeline, and support fossil fuels, such as coal. His populist rhetoric could strengthen the dollar, leading to lower energy and commodity prices.
 

The Industrial Sector

Industrial stocks levered to infrastructure projects should fare well under both Clinton and Trump. Interestingly, industrial stocks rallied earlier this year due to Clinton's aggressive infrastructure spending plan.

Hillary Clinton has proposed $275 billion in direct spending on infrastructure over five years. (click here). That’s not nearly enough, according to Trump, but at least she has a plan.

Trump is crafty and has yet to lay out a clear plan for his ambitious infrastructure agenda, a hallmark theme of his campaign. If Trump wins, congressional Republicans will most likely still control the House and can try to rein in his spending plans.
 

On corporate Taxes

As we have stated in past posts, business spending is lackluster. In fact, if you delve deeper into the numbers, you’ll discover a business recession. And the Fed can’t fix it. Profits, business investment, and ISM manufacturing are all down.

According to Fact Set’s 8.29.16 report on earnings growth: “For Q2 2016, the blended earnings decline for the S&P 500 is -3.2 percent. [2] The second quarter marks the first time the index has recorded five consecutive quarters of year-over-year declines in earnings since Q3 2008 through Q3 2009.”

So what’s the solution?

Help businesses get out of a recession with tax reform is one possible answer.

Secretary Clinton has yet to announce a corporate tax plan. However, she has stated that she wants to raise taxes across-the-board on individuals, businesses, and investors. At the risk of sounding partisan, raising taxes and regulations on businesses is not a formula for getting out of a business recession. She has proposed a “fair share surcharge” on the rich to ensure the wealthiest are not able to pay lower tax rates. Click here for Hillary Clinton's tax reform plan.

Trump, on the other hand, wants to cut the corporate tax rate from 35 to15 percent, reduce regulatory burdens, and enact a smart repatriation plan to bring a few trillion dollars in corporate cash back to America. He also wants to eliminate the corporate alternative minimum tax.  Click here for Trump’s tax reform plan.


Our bottom line

With all this information, the most important questions are:

  • How will your investment portfolio perform under new American leadership?
  • What changes in strategy are prudent?

Besides election uncertainty, high market valuations and punk earnings growth make us cautious.

The market is anticipating a Clinton win. A Trump victory would surprise markets, particularly as risk-parity trading algorithms used by the largest hedge funds and many money managers, are caught wrong-footed. Subsequently, volatility would pick up and we could experience a market correction of 5 -10 percent as risk markets adjust. Remember how markets reacted after Brexit? However, markets could get an eventual lift from a Trump victory as animal spirits get aroused because of his proposed tax and regulatory reforms.

This October could prove to be a particularly volatile month with game-changing global events converging — Brexit negotiations and the widely anticipated WikiLeaks Clinton email dump, just to name a few.

At this juncture, given our cautious position towards risk assets, we are holding higher levels of cash relative to our benchmark model allocations. A well-balanced portfolio should perform well under either candidate and weather volatile markets. And in a growth-starved world, a disciplined asset allocation strategy will be a key determinant of your portfolio returns.
 

Sources: The Wall Street Journal Online; Bloomberg News; Forbes.com; The Economist.com; CNBC News; CNN.com; Reuters News.

Footnotes:
1.  Glass-Steagall Legislation from Wikipedia, the free encyclopedia.
2.  Fact Set Earnings Insight, August 29, 2016.

GDP growth is grinding lower

photodune-17164577-inside-american-economy-m.jpg
The market, if it can be kept honest and competitive, does provide very strong incentives for work effort and productive contributions. In their absence, society would thrash about for alternative incentives-some unreliable, like altruism; some perilous like collective loyalty; some intolerable, like coercion or oppression.
— Arthur Okun, Economist

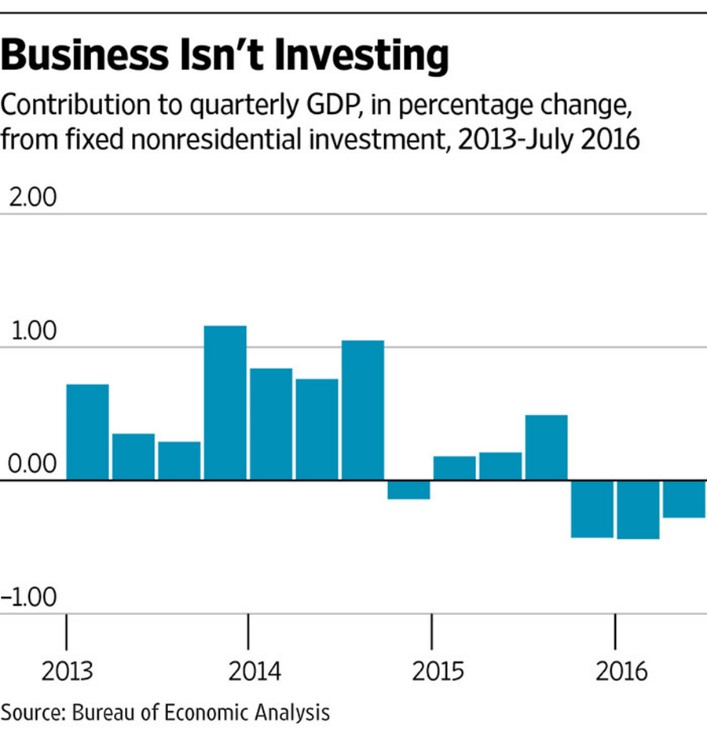
On Friday, July 29th, the Commerce Department reported that the economy grew at a meager annual rate of only 1.2 percent for the second quarter, compared with Wall Street estimates of 2.6 percent -- a big miss. GDP growth also was revised down to 0.8 percent from 1.1 percent estimate for the first quarter. 

The one bright spot in the second quarter was consumer spending, but the consumer can’t drive growth single-handedly.
 

Q2 2016 Declining Biz Spending.jpg

Higher Uncertainty

Business investment went into negative territory for the second quarter, reflecting higher uncertainty about the economic and political outlook. Until they have a better sense of the regulatory environment post-election, CEOs will be conservative with their balance sheets and hold off on investing new capital.


In our January post entitled “Outlook 2016: correction or crisis?”, we cited the following astute insight from UBS analyst, Stephen Caprio: “While bank lending standards are healthy, we ultimately believe this misdiagnoses the pulse of the corporate credit cycle. Nearly all of the additional financing provided to nonfinancial corporates has come from non-bank sources, post-crisis.” Caprio continued, “In short, non-bank liquidity has been the main driver of the corporate credit cycle post-crisis, and there are now early signs that it is evaporating.”
 

In Brief

  • The current economic recovery that began in March 2009 is the weakest since World War II.
     
  • Stock Market Valuation: the forward 12-month P/E ratio is 17.0, above the 5-year and 10-year averages and median of 14.63. This P/E ratio is based on Thursdays closing price of 2170.06, and the forward 12-month EPS estimate is $127.93. [1] Earnings came in at $120 in 2015.
     
  • The Dollar/Yen & Treasuries: the headwind of a stronger dollar in 2015 is now a tailwind for earnings. My mother traveled to Japan a year ago and $1= 123 yen…today, $1=101 yen. The 10-year treasury yield then was about 2.20 percent...today, 1.54 percent. Both are considered safe-haven asset classes and signs of risk aversion by global investors.
     

national debt: $19.2 trillion

Another harsh reality: as of June 2, 2016, the national debt is a whopping $19.2 trillion, nearly double what it was prior to the Obama presidency.  justfacts.com/nationaldebt.asp.

This amounts to:

  • 105% of the U.S. gross domestic product.[2]
  • 51% of annual federal revenues.[3]

In CWM's "Is this the end of our Goldilocks economy", we cited that: "according to a Congressional Budget Office (CBO) report released in January of this year, once the Fed begins raising rates, the 10-year Treasury note will begin rebounding to its historic norm and reach 4.6% by 2025. This return to normalization will raise our national debt payments from $227 billion a year in 2015 (1.3% of GDP) to over $820 billion by 2025 (3.0% of GDP, the highest ratio since 1996). Future costs of servicing our national debt due to higher interest rates could present a real drag on GDP."
 

The summer of our Disenchantment

After watching both the Republican and Democratic conventions, I didn’t come away feeling enthusiastic about the prospects for a stronger economy. The middle class continues to lose ground in America and abroad, feeling disenfranchised and very concerned for their future. This same atmosphere led to the rise of the populist movement towards de-globalization that resulted in Brexit, the United Kingdom exiting the European Union.

We can’t afford another lost decade in our markets due to lax oversight of Wall Street, misaligned corporate interests, and a dysfunctional government. Unless American leadership get it's act together, we could be headed for a prolonged period of economic secular stagnation. In simple terms, we need real growth spurred by business investment from the private sector and smart fiscal policy. It’s the only way to increase economic growth, create jobs, raise wages, and promote the American Dream for all.

Sources: The Wall Street Journal Online; Bloomberg News; Forbes.com; The Economist.com; CNBC News; CNN Money.com.

Footnotes:
1.  FactSet Earnings Insight, July 29, 2016
2.  Dataset: “Table 1.1.5. Gross Domestic Product.” U.S. Department of Commerce, Bureau of Economic Analysis, May 27, 2016. <www.bea.gov>
3.  Dataset: “Table 3.1. Federal Government Current Receipts and Expenditures.” U.S. Department of Commerce, Bureau of Economic Analysis, May 27, 2016. <www.bea.gov>

Brexit Wins: A vote that changes everything … or does it?

Contrary to what many establishment elites assumed, The United Kingdom voted to leave the European Union in a historic vote on Thursday, June 23. Heading into last Wednesday, the polls were running about even for staying (Bremain) and leaving (Brexit). The final voting tally was 52 percent to 48 percent, and the out-of-touch “establishment elites" are stupefied by the referendum by British voters to leave the E.U.

Markets reacted in dramatic fashion as many investors were caught wrong-footed by the Brexit win, and by the closing bell on Friday, the Dow Jones Industrials had lost over 600 points. The S & P just dropped below its 200-day moving average as of the writing of this piece at 10:15 a.m., Monday, June 27 - an ominous trading sign. Safe haven assets, such as gold and U.S. Treasuries have rallied in typical response to a perceived negative market event.
 

In brief:

  • This is not a 2008-type crisis. We could be heading for a prolonged period of ambiguity as markets sort through the U.K.’s “divorce details” from Europe. We could experience continued bouts of volatility in the weeks ahead, particularly in currency markets.
     
  • The tip of the iceberg? The Brexit trend could have a “domino effect” elsewhere in the world. Voters everywhere have grown increasingly disenchanted with the outcomes of globalization over the past 25 years. Note: next year, France and Germany head to the polls. If "de-globalization" sentiment continues to build, the effects could be significant for the future of the European Union and elsewhere.
     
  • Politically, it’s not over: The U.K. government is in turmoil as Prime Minister Cameron has announced his resignation effective in October. It will be up to the new PM to trigger Article 50 of the Lisbon Treaty and begin the two-year process of negotiating the U.K.’s exit from the EU and new trade deals.
     

Why Brexit now?

There has been a growing populist political movement in the U.K. (as well as in the U.S.), fueled by British middle-class concern over their future due to lax immigration rules and an open-border policy between EU members. The rise of ISIS and recent horrific terrorist attacks have served to fuel voter angst. The Brits evidently have had “enough of experts.” Globalization didn’t work out as well as promised; middle-class citizens have watched their wages remain stagnant for decades.


What happens next?

As mentioned above, Prime Minister Cameron, who backed the “Bremain Camp,” has made it clear that the decision to trigger the U.K. divorce with Europe under Article 50 of the Lisbon treaty is for his successor. Many believe the new prime minister will be Boris Johnson, former mayor of London and a chief “leave campaigner.” The new PM will begin the negotiation of new trade agreements with Europe in October, and it could get contentious. The rest of Europe is none too excited about losing one of EU’s largest members.

Between now and October, there is a leadership vacuum that will likely result in continued political turmoil in the U.K. It remains to be seen if the U.K. anti-establishment vote has a “domino effect” elsewhere, particularly here at home in our presidential race. Our equivalent to Boris Johnson, some might say, is Donald Trump. Additionally, given the lack of clarity surrounding Brexit details, business investment spending (capex) is likely to remain on hold, furthering the probability of a recession in the U.K.

The Brexit still needs to be approved by the majority of the remaining European Union members in October. Just as with any divorce, there is going to be a period of adjustment as both sides work out their differences. 

The U.K. is one of the largest economies in the world, and London is a key global financial center. As such, investors are understandably concerned. However, I believe expert economists who are promulgating dire global market consequences from the Brexit are simply wrong. Keep in mind, the European continent has been in a prolonged recession since the U.S. triggered a financial crisis in 2008, with the U.K. being in the best financial shape of the group. While the Brexit hurts European growth in the near term, the U.K. could benefit from better re-negotiated trade deals. A cheaper pound will certainly help U.K. exporters in global trade, offsetting some of the economic damage from the Brexit.
 

The Pound is getting "pounded" by markets, hitting a 20-year low against the dollar.

The Pound is getting "pounded" by markets, hitting a 20-year low against the dollar.

Markets will continue to be choppy as Brexit angst weighs on investor sentiment. Many banks and money managers will be forced to liquidate holdings to meet redemptions and reduce risk. However, this does not appear to be an '08 - caliber panic event. Central banks have made it clear that they stand ready to intervene and provide liquidity to markets. It’s now likely that the Bank of England will cut rates in July and rate changes by our Fed will remain on hold until after the November elections. From a credit perspective, the ratings agencies have announced that the UK’s sovereign debt will be downgraded as a result of the decision to breakup with Europe. And downgrades could widen credit spreads.


Our bottom line: 

During market corrections, it’s important to remain calm and keep in mind that investment opportunities are borne out of market uncertainty and panic. A post-Brexit backdrop will create some fallout in markets along with inefficiencies, creating opportunity in high-quality U.K. equities, bonds and other global asset classes. U.K. businesses have been hit hard here, and some of the impacts of the Brexit vote may already be reflected in prices.

This is the type of environment where "best-in-class" long-term asset managers would be expected to add value by seeking out undervalued assets. At Cambridge Wealth Management, we will continue to look for opportunities where assets have become attractively priced due to market dislocation. However, we’re not rushing to purchase any assets, as we remain mindful of the challenges in the near–term. Public sentiment and geopolitics are ever shifting, but great leaders and businesses always seem to find a way to adapt quickly and prosper!


Sources: The Wall Street Journal Online; Bloomberg News; Financial Times; Forbes.com; The Economist.com; MFS research; Fidelity research; CNBCNews.com.


Observations and views expressed herein may be changed at any time without notice and should not be construed as investment advice or to predict future performance. It is not an offer, recommendation or solicitation to buy or sell. It is based on information generally available to the public from sources believed to be reliable. Changes to assumptions may have a material impact on any returns detailed. Past performance is not an indication of future returns. Please consult your financial professional before making an investment decision.

How to Turn Puerto Rico into Hong Kong

How to Turn Puerto Rico into Hong Kong

This article, written by Townhall.com columnist Stephen Moore, provides a concise overview of the imminent Puerto Rican (PR) debt crisis and suggests a grand plan as a solution. Some Puerto Rico municipal bonds have lost 50 to 70 percent of their value, enticing vulture funds to purchase considerable amounts of the distressed debt...

Outlook 2016: Correction or crisis?

Simple can be harder than complex: You have to work hard to get your thinking clean to make it simple. But it’s worth it in the end because once you get there, you can move mountains.
— Steve Jobs

The choppy trading in global stock markets has set the tone for a turbulent year ahead. Since the start of 2016, investors have pulled about a billion dollars daily out of equity mutual funds through Friday, January 15. The beneficiary of these equity sales has been the natural safe haven: cash and U.S. Treasury bonds. 

With markets off to their worst start since 1927, investors are nervous. And unlike last August, it doesn’t appear this market is going to bounce back anytime soon. The panicky price action has brought the market bears out in full force. On Friday, the Dow Jones Industrials lost another 391 points, oil traded below $30 for the first time in 12 years, and Europe officially entered bear market territory (20% decline from a prior market high). 


Global head-scratching

So what’s causing this dramatic reduction in investors’ appetite for risk?  

Some of the reasons, in our opinion, are familiar:

  • China's slowdown,
  • Plunging oil prices, and
  • The strong dollar.

However, unlike five months ago, when it seemed the global economy was picking up momentum, investors are beginning to think that perhaps there is a fundamental deterioration in global growth. This fear of a recession is fueling a selling stampede in global markets. We think, barring seismic-type events stemming from a sudden devaluation of the Chinese currency, further deterioration in credit spreads, or tensions in the Middle East flaring up, the probability that the U.S. economy slips back into recession remains relatively low.

As this juncture, it’s important to outline some key data points to help put the current market turmoil in perspective. 

To begin with, market pullbacks in the 10% range are not uncommon and are healthy for markets. In fact, we should experience about one per year. However, until last August, we had not experienced a market correction of 10% since 2011, and we thus had grown accustomed to low volatility in markets (thanks to our Fed’s accommodative zero interest rate posture (ZIRP). Last August, when the Chicago Board Options Exchange Volatility Index (VIX), a measure of investor fear, spiked to 50, we mentioned in "China's currency reset is a game changer" that such events tend to cluster -- experiencing a few back-to-back market pullbacks, after such low volatility, should be expected. The VIX recently spiked again and touched 30.95 on Friday.

Cautionary note: the chart below illustrates the market uptrend that began during the European debt crisis in 2011 has been broken. It appears the neckline of a large head and shoulders top (technical analysis jargon) is forming, signaling the reversal of a prior bullish trend.

Source: Bloomberg

Source: Bloomberg

China's slowdown

The Chinese economy is undergoing a massive transition, from an export-led economy to a consumer-led economy. This means lower rates of growth but just how low remains the big question for markets. The market consensus is hoping for about 6.5% GDP growth rate in 2016, down from about 7% in 2015 (we may never really know the actual numbers). Adding to investor’s concerns, Chinese regulators continue to fumble the ball when dealing with its market regulations. It now seems that Chinese policymakers are struggling to find the proper tools to help engineer an economic “soft landing”in their slowing economy.

If growth rates come in lower than 6% for China's economy in 2016, it could trigger further Yuan devaluation by the PBoC to lift its economy. Yuan devaluation exports deflation globally, and it would likely trigger a new round of global currency wars by Central Banks. China shocked markets when it suddenly devalued its Yuan in August 2015, and central bank officials have been struggling since to make sense of China's intentions.

Another really interesting piece of information related to the Yuan is this:

As the dollar has strengthened, it has become increasingly costly for the Peoples Bank of China (PBoC) to maintain the Yuan's peg to the dollar. It's estimated that China has lost more than 700 billion in foreign-exchange reserves (currently about 3.3 trillion) since mid-2014 by maintaining its currency link to the U.S. dollar.

Source: Bloomberg&nbsp;

Source: Bloomberg 

Plunging oil

The free fall in crude oil prices has continued to unsettle commodity, stock, and corporate bond markets. Oil prices dipped below $30 on Friday and West Texas crude prices have fallen nearly 20% year-to-date. The current situation appears to be overwhelmingly supply-based and dollar-related. And with sanctions on Iran lifted, there is more oil coming to market. At some point, there will be a balanced market clearing level, perhaps as soon as the second half of this year.

Currently, the plummet in oil prices below $30 a barrel is causing a lot of distress in the energy sector, and banks are preparing for the worst by putting aside extra loan loss reserves. According to a recent Standard & Poor’s report, 50 percent of energy junk bonds are now distressed, meaning they are at risk of default. Distress in the oil patch could reduce S & P earnings by 7 - 8% in 2016.
 

The Strong Dollar

Last, on one hand, the fallout in oil prices can be viewed as a positive for global consumers; on the other, it could lead to geopolitical risks. Commodity exporting countries have seen their currencies continue their year-long decline against our dollar in 2016. The Brazilian real has plunged about 36% against the dollar over the past year.
 

The U.S. economy is in a soft patch

Manufacturing indexes have fallen recently, bordering on contraction, but this has occurred before in mid-cycle ‘soft patches’. Keep in mind, the modern U.S. economy is dominated by services — which have held up to date much better than expected. While recessions are never ruled out as a possibility at any time, key signals continue to show a low probability of a U.S. recession, such as healthy consumer and steady, albeit slow GDP growth.
 

Non-bank lending tightness portends downside growth risk

In an October 2015 research note, UBS analyst Stephen Caprio stated: “In sum, we believe non-bank lending standards illustrate an overall tightness in U.S. financial conditions that signal a downside growth risk in the U.S. economy. While bank lending standards are healthy, we ultimately believe this misdiagnoses the pulse of the corporate credit cycle. Nearly all of the additional financing provided to non financial corporates has come from non-bank sources, post-crisis” Caprio continued, “In short, non-bank liquidity has been the main driver of the corporate credit cycle post-crisis, and there are now early signs that it is evaporating.”


What can you do to protect your portfolio?

Data and sentiment change daily. With so many new market variables at work, it’s important to maintain a clear, calm, and longer-term perspective. It's of particular importance to embrace a disciplined process to guide investment decision-making during challenging periods of heightened volatility. Our disciplined investment approach actively uses a set of principles that grows and protects your wealth as we guide you through the ups and downs of the stock market.

It's also important to keep in mind that markets provide a benchmark for asset valuation. According to a FactSet Earnings Insight report 9.4.15 cited in our market viewpoint entitled "Is this the end of the Goldilocks Economy?", the S&P 500 consensus earnings estimate stood at $128 per share for 2015. Earnings for the S&P 500 came in at about $120 per share in 2015, roughly the same as 2014, resulting in a flat year for the market in 2015.


Uncertainty presents opportunity

For 2016, the S&P 500 Index consensus forward 12-month EPS estimate is $125.48. In our view, market valuations now look pricey at a time when our Fed has begun raising interest rates, global trade is slowing, and corporate profit margins appear to be peaking. Also, the ongoing Chinese yuan depreciation presents significant deflationary/market risks as other countries may be forced to devalue to remain competitive.

Given our outlook for 2016, we maintain our underweight position in equities and overweight cash/credit-related assets relative to our asset allocation model benchmarks. At this market juncture, it's prudent to have above average cash on hand for future undervalued investment opportunities. We remain vigilant as the current market uncertainty presents an opportunity to identify mispriced assets due to disparities between fundamentals and capricious investor sentiment.


Sources: The Wall Street Journal; Bloomberg News; Financial Times; Investors Business Daily; Forbes.com; CNBC.com; The Economist.

Observations and views expressed herein may be changed at any time without notice and are not intended as investment advice or to predict future performance. It is not an offer, recommendation or solicitation to buy or sell. It is based on information generally available to the public from sources believed to be reliable. Changes to assumptions may have a material impact on any returns detailed. Past performance is not an indication of future returns. Please consult your financial professional before making an investment decision.

Is this the end of the goldilocks economy?

Nothing astonishes men so much as common sense and plain dealing
— Ralph Waldo Emerson

The extreme volatility that we witnessed in recent weeks continued to recede heading into last week’s Federal Reserve Bank Open Market Committee (FOMC) meeting. 1 I believe that as we slowly transition out of this “Goldilocks economy”, and the Fed begins raising interest rates, market volatility could remain at elevated levels.

The Fed's Conundrum
The market initially breathed a sigh of relief as the Fed maintained its accommodative policy on Thursday. According to FactSet's September 4 report, “The second quarter of 2015 marks the first time the index has seen two consecutive quarters of year-over-year revenue declines since Q2 2009 and Q3 2009. It also marks the largest year-over-year decline in revenues since Q3 2009 (-11.5%).”2 The report mentioned that only six sectors were reporting increases in revenue, led by healthcare.

Slowing global growth, along with the strong dollar, could continue to be a headwind to the earnings estimates. The S & P 500 is expected to earn about $128 based on September 4th closing price of 1951.3 according to FactSect Earnings Insight 9.4.15. In his September Insights piece, Rich Bernstein states: “The Fed now risks being wrong-footed, and the problem for the stock market today is the Fed is ‘threatening' to raise interest rates at a time when the S & P 500® earnings growth is actually negative.”4

A look at history: Fed rate hikes & market performance
The chart below illustrates the return of the S & P 500 after the last four Fed rate hike cycles. In most cases, equities struggled after the first hike, only to recover and outperform in the ensuing year following the first rate increase. Click here for a quick lesson from Investopedia on, "How interest rates affect the stock market."

Source: Morningstar and FPS, Inc.

Source: Morningstar and FPS, Inc.

The markets have become addicted to QE and a zero interest rate policy (ZIRP). Getting rid of it will involve some withdrawal pain. According to a Congressional Budget Office (CBO) report released in January of this year, once the Fed begins raising rates, the 10-year Treasury note will begin rebounding to its historic norm and reach 4.6% by 2025. This return to normalization will raise our national debt payments from $227 billion a year in 2015 (1.3% of GDP) to over $820 billion by 2025 (3.0% of GDP, the highest ratio since 1996).3  So, one can imagine why the markets are obsessing over successive rate hikes. Future costs of servicing our national debt due to higher interest rates could present a real drag on GDP.

Expect lower interest rates for longer
The Fed's accommodative ZIRP has been a key driver behind the bull market we have enjoyed over the past several years. It’s not the first rate hike that's concerning the market, as it’s been talked about more than just about any other financial topic over the past few years. It's the speed and severity of successive hikes — markets want a slow and steady path back to normalized rates. Our view remains that it could take longer than expected for Treasury yields to normalize because of slow economic growth, low inflation, and robust demand for our 10-year and 30-year Treasury debt from home and abroad.

Footnotes:
1.    Investopedia: VIX (CBOE Volatility Index). Definition. http://www.investopedia.com/terms/v/vi
2.    Fact Set Earnings Insight, September 4, 2015.
3.    Congressional Budget Office Report, "The Budget and Economic Outlook: 2015-2015" January 2015.

Observations and views expressed herein may be changed at any time without notice and are not intended as investment advice or to predict future performance. It is not an offer, recommendation or solicitation to buy or sell, nor is it an official confirmation of terms. It is based on information generally available to the public from sources believed to be reliable. Changes to assumptions may have a material impact on any returns detailed. Past performance is not an indication of future returns. Price and availability are subject to change without notice. Consult your financial professional before making an investment decision. Additional information is available upon request.

Q2 2015 Market Insights & Strategy

The problem with Socialism is you eventually run out of other people’s money
— Margaret Thatcher

The start of the second quarter was greeted by a surprisingly weak employment report on Good Friday. The market bears came out of hibernation and immediately began growling for a market correction after March non-farm payrolls showed an increase of only 126,000 jobs vs. Reuters' expectations of 245,000. After a brief sell-off at the opening bell on Monday, the market has rallied back, and it continues to "climb the wall of worry".

The current economic recovery that began in March 2009 is now six years old, and it's showing some signs of fatigue. Given this fact and the current market volatility, you may be asking, “What should I do as an investor at this market juncture?” To answer this question, let’s take a look at some of the current market headwinds facing investors:
•    Europe has essentially been in a depression since the financial crisis of 2008.  The dollar has appreciated about 20% against the Euro since June 2014 as the European Central Bank began its own Quantitative Easing (QE) last June to spur growth and stave off deflation.  QE is buying bonds with money printed by the central banks in order to push down long-term interest rates and encourage investment. The Bank of Japan was the first to engage in QE about 14 years ago, and it's resulted in a period of secular economic stagnation for Japan (perhaps an understatement). Our Federal Reserve Bank began its QE policy in 2008 with QE 1, and then QE 2 and a QE 3 in June 2011 (Europe, as you may recall, was on the verge of disaster). Since then, the Fed has added over 4 trillion of US bonds/debt to its balance sheet, and we've continued to ignore the market mavens and former colleagues call to sell high coupon bonds. Instead, we've bought any spikes in yields for retiree and trust accounts, most recently in December of 2013 when the 10-year Treasury yield approached 3%.
•    The dollar’s strength has caught many investors by surprise and has led to a precipitous drop in the price of oil from about $99 in June 2014 to current levels around $51. At CWM, we think the strong dollar is a sign of continued strength in the US and not just a flight to quality.
•    US Treasuries have rallied the past year, particularly the long end. The 10-year Treasury is still below 2.00%.  The US 10-yr @ 1.91% vs. Germany's equivalent @ .016% and Japan's equivalent @.365% as of this writing.

Chief Economist of Gluskin Sheff, David Rosenberg, thinks the stronger dollar is already acting as a tightening mechanism (higher interest rates) as US corporate profits have begun to get squeezed.  He states, “The Fed would be well advised to sit back, watch, and assess--- and let the dollar do the heavy lifting.” Corporate America, according to some estimates, lost over 18 billion in Q4 2014 due to the stronger dollar. The market is an efficient pricing mechanism, and we think it has adequately priced in the effects of a stronger dollar on corporate earnings going forward.

In his April Market Insights, Rich Bernstein (a market bull) of Richard Bernstein Advisors begins by stating “Beauty is in the eye of the beholder – the same can be said for equity valuations”. His conclusion based on his quantitative work:  “the market is valued as it would typically be for a mid-cycle period, roughly fairly valued”.

This bull market is one that many market pros seem to hate--market pullbacks of 5 - 8% are healthy. Once the Fed makes its move, perhaps later this year, we think the markets will act more decisively. We suspect that liquidity will not be shut off by Central Banks in the form of significant tightening this year.
  
The following highlights CWM’s investment strategy for the balance of 2015:
•    We're overweight growth vs. value. We expect the US market to move sideways as earnings estimates are too high. German and Japanese markets may play some catch-up.  
•    In Q1, we closed out our tactical overweight in TLT, (20+ yr. US Treasury Bond ETF).  Its outperformance surprised us as we merely saw value in the long-end of the yield curve.  The return in TLT was accentuated by QE in Europe -- it moved from 101.72 on 01.02.14 to over 131 on 01.06.15.  
•    We have shortened bond maturities and duration for the first time in nearly a decade. However, we think the move higher in interest rates will be gradual—do not fret.  GDP growth is still anemic compared to prior recoveries and as such, the market has become addicted to QE. There is too much capital, however, chasing too little value in bonds, especially short duration bond funds ( i.e. asset bubble).
•    We have a tactical overweight in Germany and Japan and expect these markets to outperform the US in 2015 given the dollar strength. The strong dollar favors strong manufacturing, exporting countries such as Germany and Japan.
•    Cheap energy stocks/drillers do not represent value in our opinion. Value is determined by cash flow and assets, and both are at risk in this sector. We leave it up to the best-in-class private equity and hedge fund managers to determine what represents good value in this sector. We sold our remaining energy MLP in early January 2014 given the inverse relationship between a strong dollar and oil/gas prices.
•    We think writing covered calls at the upper end of the current trading ranges is a prudent strategy in a range-bound market---enhancing total return with income from premiums while lowering cost basis and volatility.
•    We continue to favor technology, particularly medical technology, and healthcare at this juncture.
 
The larger question on our minds is can central banks usher in a new era of economic stability marked by low rates, modest growth, and stable inflation? Only time will tell the economic implications of this great monetary experiment called QE. Like Japan, we could be headed for a prolonged period of secular economic stagnation. Our Federal Reserve Bank Chairman, Janet Yellen, recently voiced such a concern. Much of the excess capital created by our Federal Reserve Bank QE policy has yet to find its way back to Main Street USA in the form of job-producing growth and capital goods expenditures. We think, however, Good Friday's employment report is just another lumpy employment number and not a harbinger of a weakening economy. At this market juncture, it’s time for the consumer to grab the baton it’s being handed and finish the last leg of this economic recovery with strength. 

*note:  the market prices quoted above are obtained from cnbc.com.  Certain quotes were obtained from Investor Business Daily and Bloomberg news service and are for informational purposes only.  We assume no responsibility for the timeliness, accuracy, or truthfulness of content derived from unaffiliated third-party sources as stated under "Disclaimer of Warranty" under the site's "Terms of Use". 
Past performance may not be indicative of future results.  Different types of investments involve varying degrees of risk. Therefore, it should not be assumed that future performance of any specific investment or investment strategy (including the investments and/or investment strategies recommended or undertaken by Cambridge Wealth Management, LLC) will be profitable or equal the corresponding indicated performance level(s).